
















Copyright: ©Author(s) 2026.
World J Psychiatry. Jul 19, 2026; 16(7): 117803
Published online Jul 19, 2026. doi: 10.5498/wjp.117803
Published online Jul 19, 2026. doi: 10.5498/wjp.117803
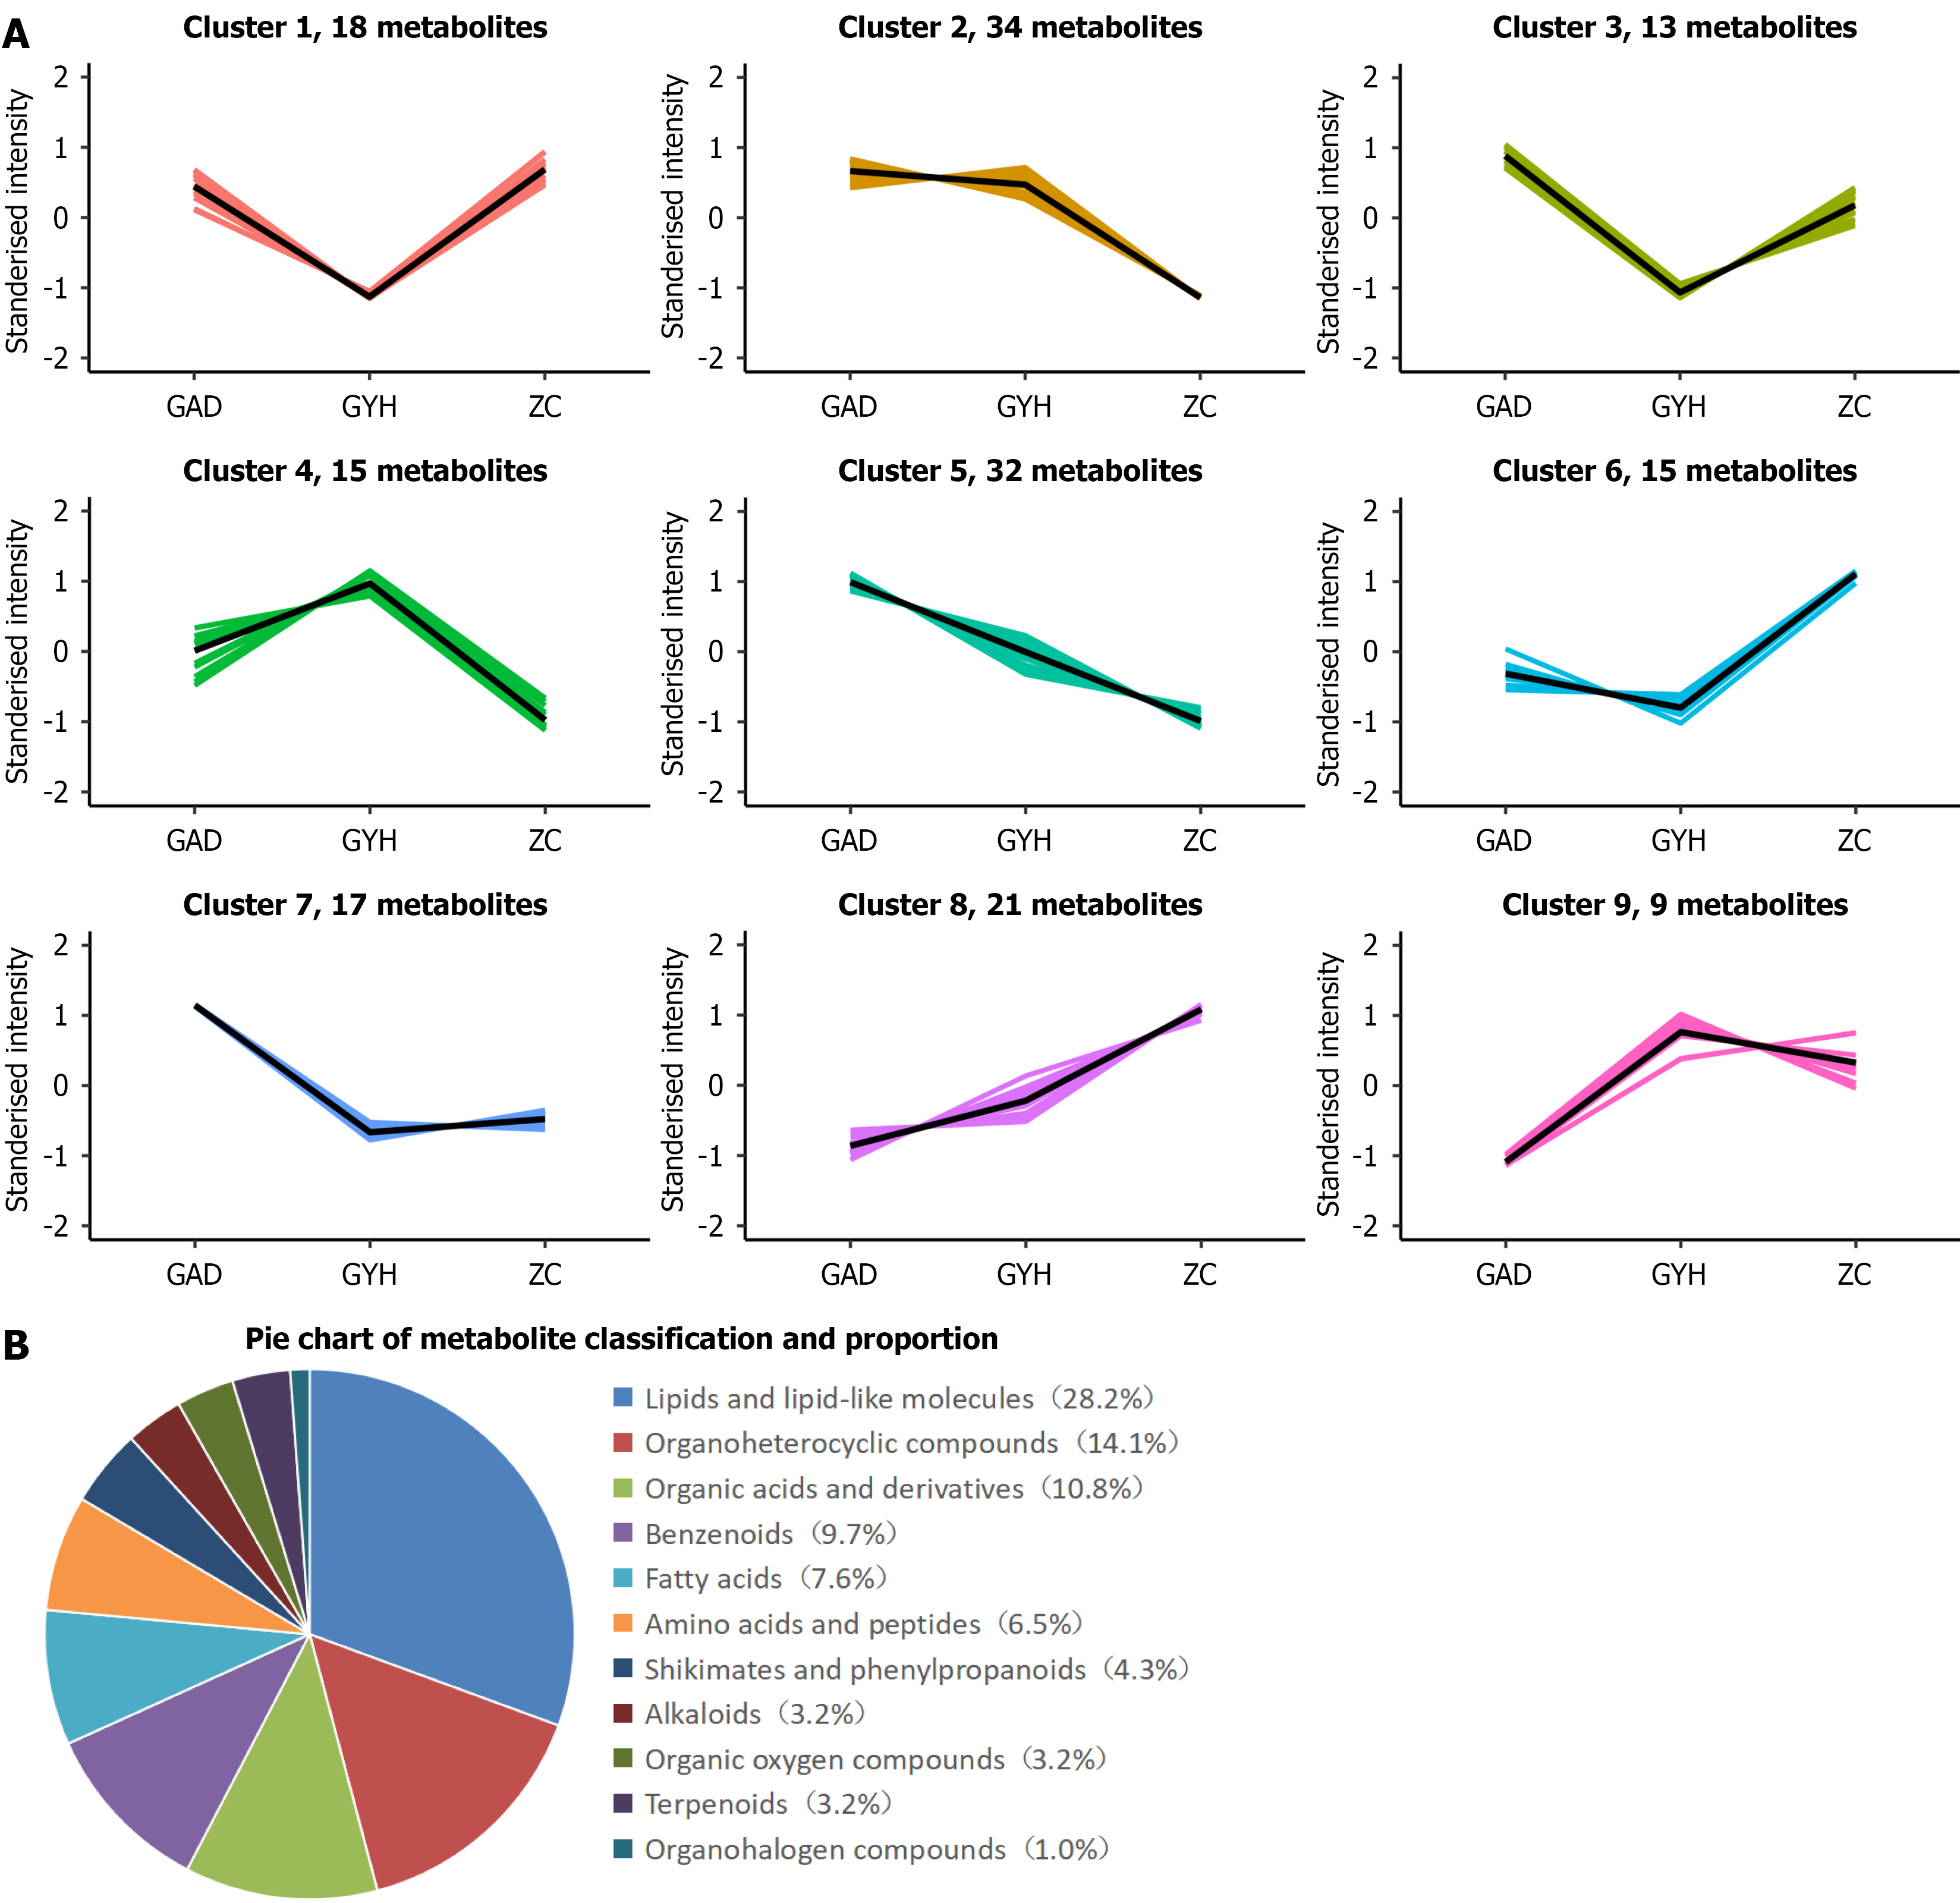
Figure 6 K-means plot and differential metabolites proportion.
A: K-means plot, the horizontal coordinate in the figure represents the sample group name, the vertical coordinate indicates the relative content of metabolites after normalization, and the cluster represents the same change trend as a cluster; B: The classification and proportion of differential metabolites.
- Citation: Zhang J, Li WB, Wang XX, Han TT, Dong S, Sang YN, Lu M, Guo XH. Congqi Shoushen Tuina Method for generalized anxiety disorder: Clinical outcomes and serum metabolomic profiles. World J Psychiatry 2026; 16(7): 117803
- URL: https://www.wjgnet.com/2220-3206/full/v16/i7/117803.htm
- DOI: https://dx.doi.org/10.5498/wjp.117803