
















Copyright: ©Author(s) 2026.
World J Psychiatry. Jul 19, 2026; 16(7): 117803
Published online Jul 19, 2026. doi: 10.5498/wjp.117803
Published online Jul 19, 2026. doi: 10.5498/wjp.117803
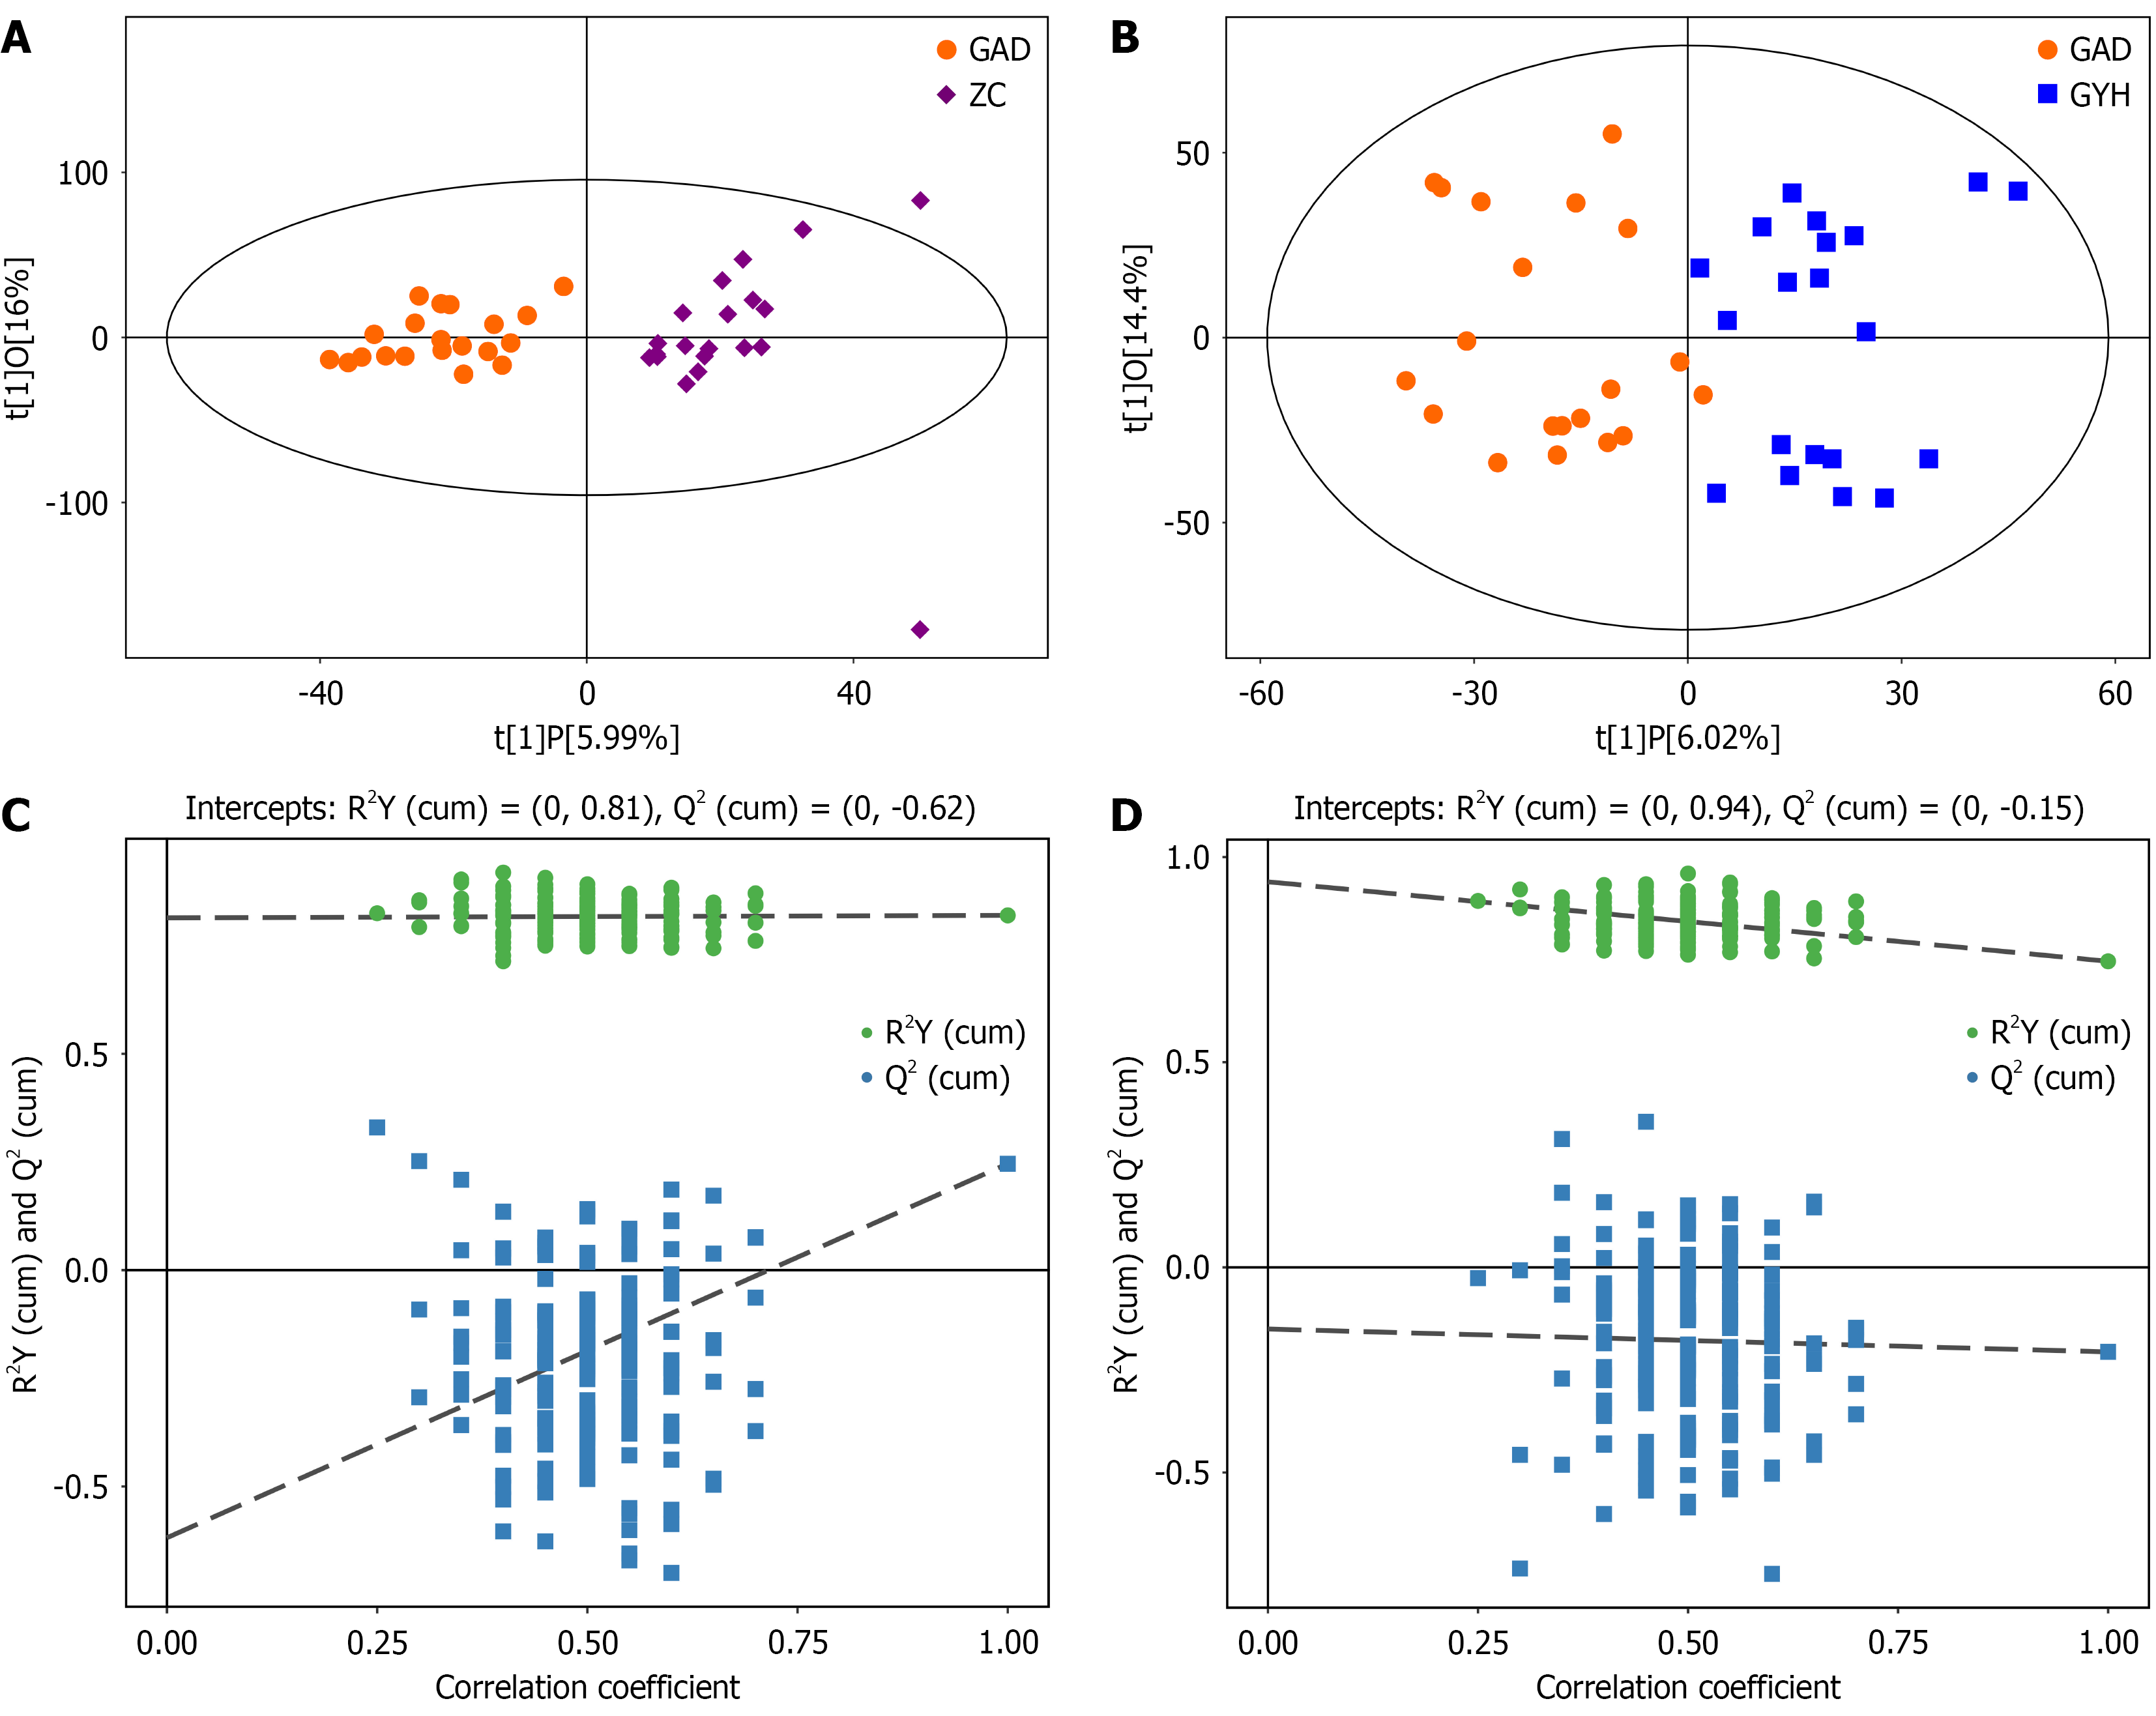
Figure 4 Orthogonal partial least squares-discriminant analysis results.
A and B: The orthogonal partial least squares-discriminant model scatter plot. In Figure 4A, orange circles represent the samples from the generalized anxiety disorder (GAD) group, while purple diamonds represent the samples from the control group. In Figure 4B, orange circles denote the samples from the pre-intervention GAD group, and blue diamonds denote the samples from the post-intervention GAD group. The samples in each group are roughly distributed within the same interval, and the sample sets between the two groups are completely separated, indicating that the serum metabolic spectrograms of the two groups are significantly different; C and D: The orthogonal partial least squares-discriminant model permutation result dot plot. GAD: Generalized anxiety disorder; ZC: Control group; GYH: Congqi Shoushen Tuina Method group.
- Citation: Zhang J, Li WB, Wang XX, Han TT, Dong S, Sang YN, Lu M, Guo XH. Congqi Shoushen Tuina Method for generalized anxiety disorder: Clinical outcomes and serum metabolomic profiles. World J Psychiatry 2026; 16(7): 117803
- URL: https://www.wjgnet.com/2220-3206/full/v16/i7/117803.htm
- DOI: https://dx.doi.org/10.5498/wjp.117803