















Copyright: ©Author(s) 2026.
World J Psychiatry. Jul 19, 2026; 16(7): 117216
Published online Jul 19, 2026. doi: 10.5498/wjp.117216
Published online Jul 19, 2026. doi: 10.5498/wjp.117216
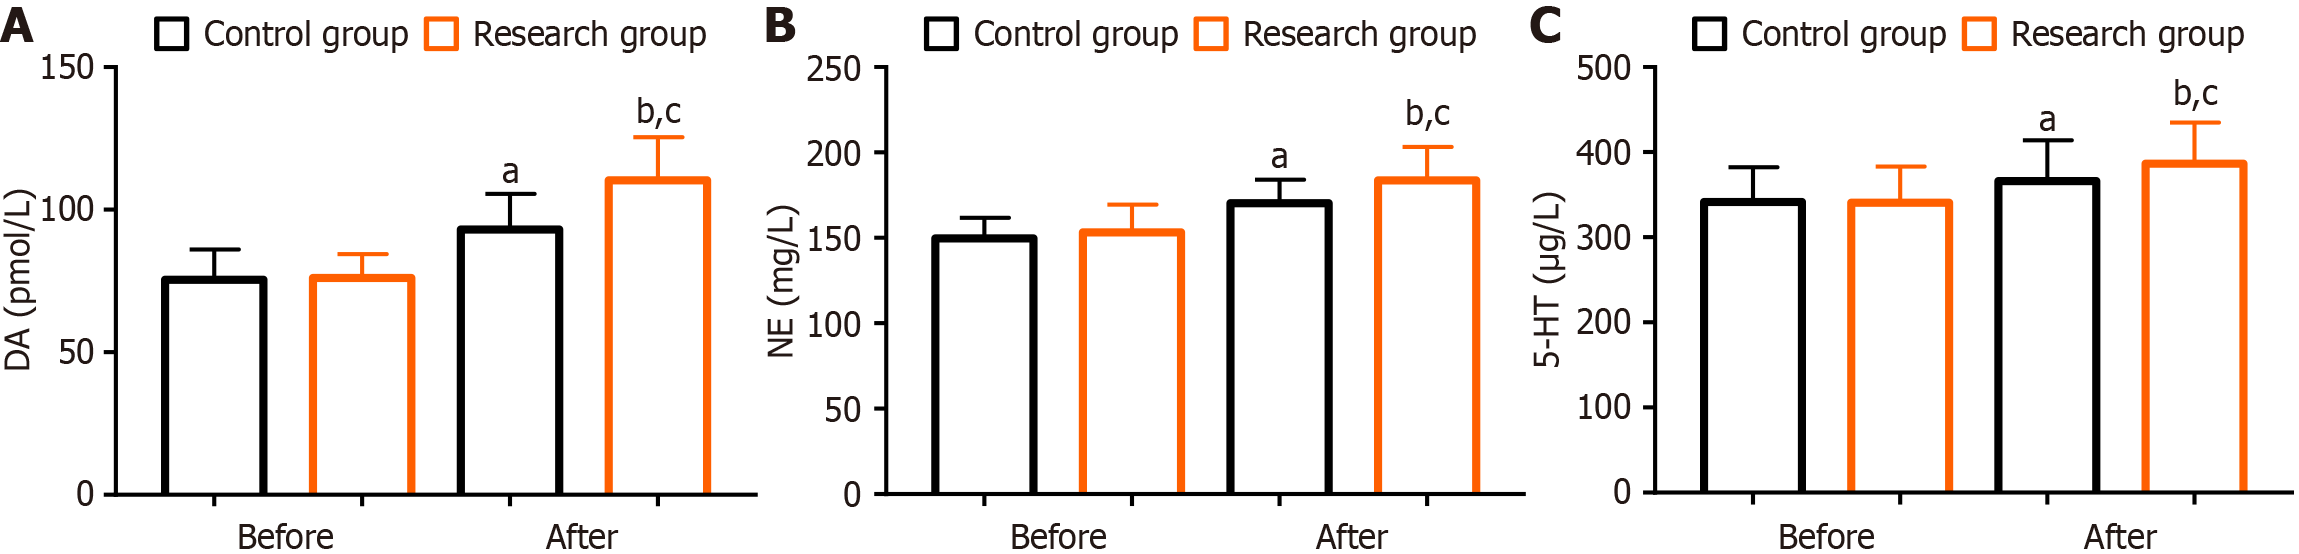
Figure 4 Comparative analysis of neurotransmitter levels.
A: Dopamine before and after treatment in the two groups; B: Norepinephrine before and after treatment in the two groups; C: Serotonin before and after treatment in the two groups. aP < 0.05, bP < 0.01 vs before treatment; cP < 0.05 vs the control group. DA: Dopamine; NE: Norepinephrine; 5-HT: Serotonin.
- Citation: Jiang PJ, Hu SW, Liao CM, Peng JJ, Liang SJ, Cheng X. Effects of phototherapy plus agomelatine on efficacy, negative emotions, and neurotransmitter levels in elderly patients with depressive disorders. World J Psychiatry 2026; 16(7): 117216
- URL: https://www.wjgnet.com/2220-3206/full/v16/i7/117216.htm
- DOI: https://dx.doi.org/10.5498/wjp.117216