
















Copyright: ©Author(s) 2026.
World J Psychiatry. Jul 19, 2026; 16(7): 117078
Published online Jul 19, 2026. doi: 10.5498/wjp.117078
Published online Jul 19, 2026. doi: 10.5498/wjp.117078
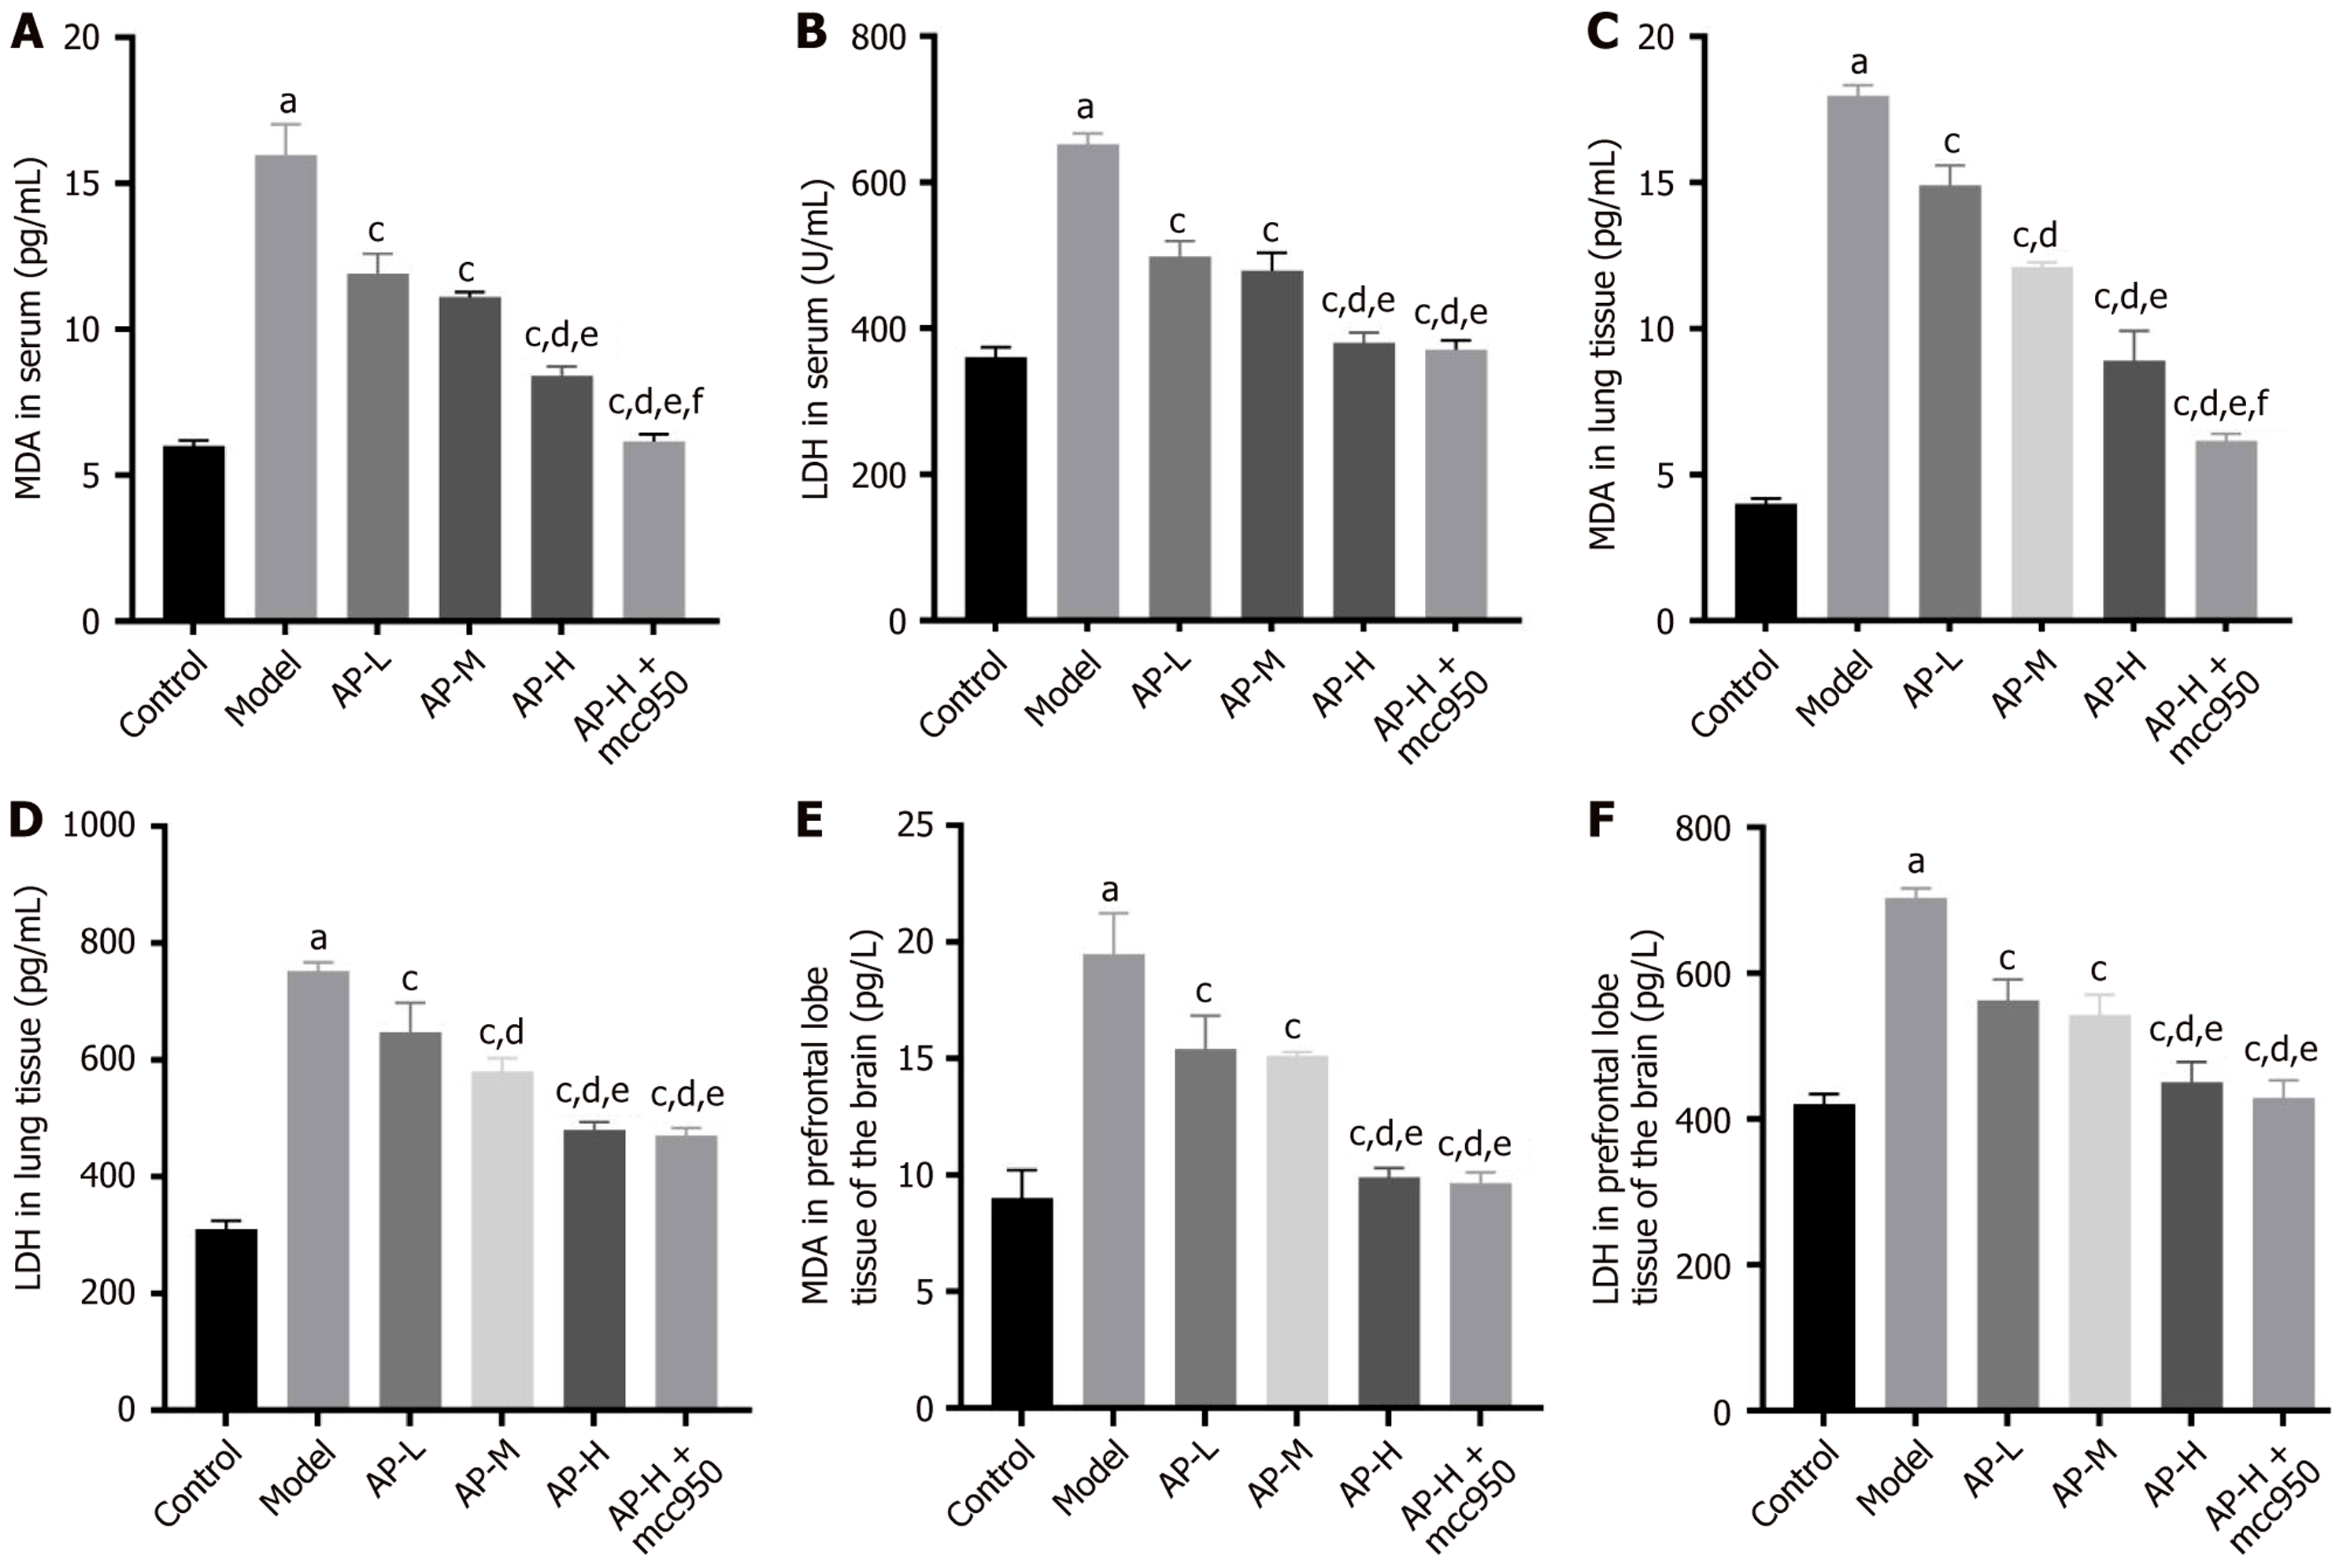
Figure 5 Comparison of the expression of oxidative stress (malondialdehyde and lactate dehydrogenase) levels in serum, lung tissue, and frontal lobe tissue homogenate of rats in different groups.
A and B: Oxidative stress in serum; C and D: Oxidative stress in lung tissue; E and F: Oxidative stress in prefrontal lobe tissue of the brain. aP < 0.01 vs control group, cP < 0.01 vs model group, dP < 0.05 vs low-dose apple polyphenols (AP), eP < 0.05 vs middle-dose AP,fP < 0.05 vs high-dose AP. AP-L: Low-dose apple polyphenols; AP-M: Middle-dose apple polyphenols; AP-H: High-dose apple polyphenols; AP-H + mcc950: High-dose apple polyphenols + NOD-like receptor protein 3 inhibitor; MDA: Malondialdehyde; LDH: Lactate dehydrogenase.
- Citation: Feng P, Ji ZX, Zhang HY, Song KY, Chen LP, Qian HH, Wang B. Effect of apple phenols on anxiety/depression in a rat model of acute exacerbation of chronic obstructive pulmonary disease. World J Psychiatry 2026; 16(7): 117078
- URL: https://www.wjgnet.com/2220-3206/full/v16/i7/117078.htm
- DOI: https://dx.doi.org/10.5498/wjp.117078