
















Copyright: ©Author(s) 2026.
World J Psychiatry. Jun 19, 2026; 16(6): 117245
Published online Jun 19, 2026. doi: 10.5498/wjp.v16.i6.117245
Published online Jun 19, 2026. doi: 10.5498/wjp.v16.i6.117245
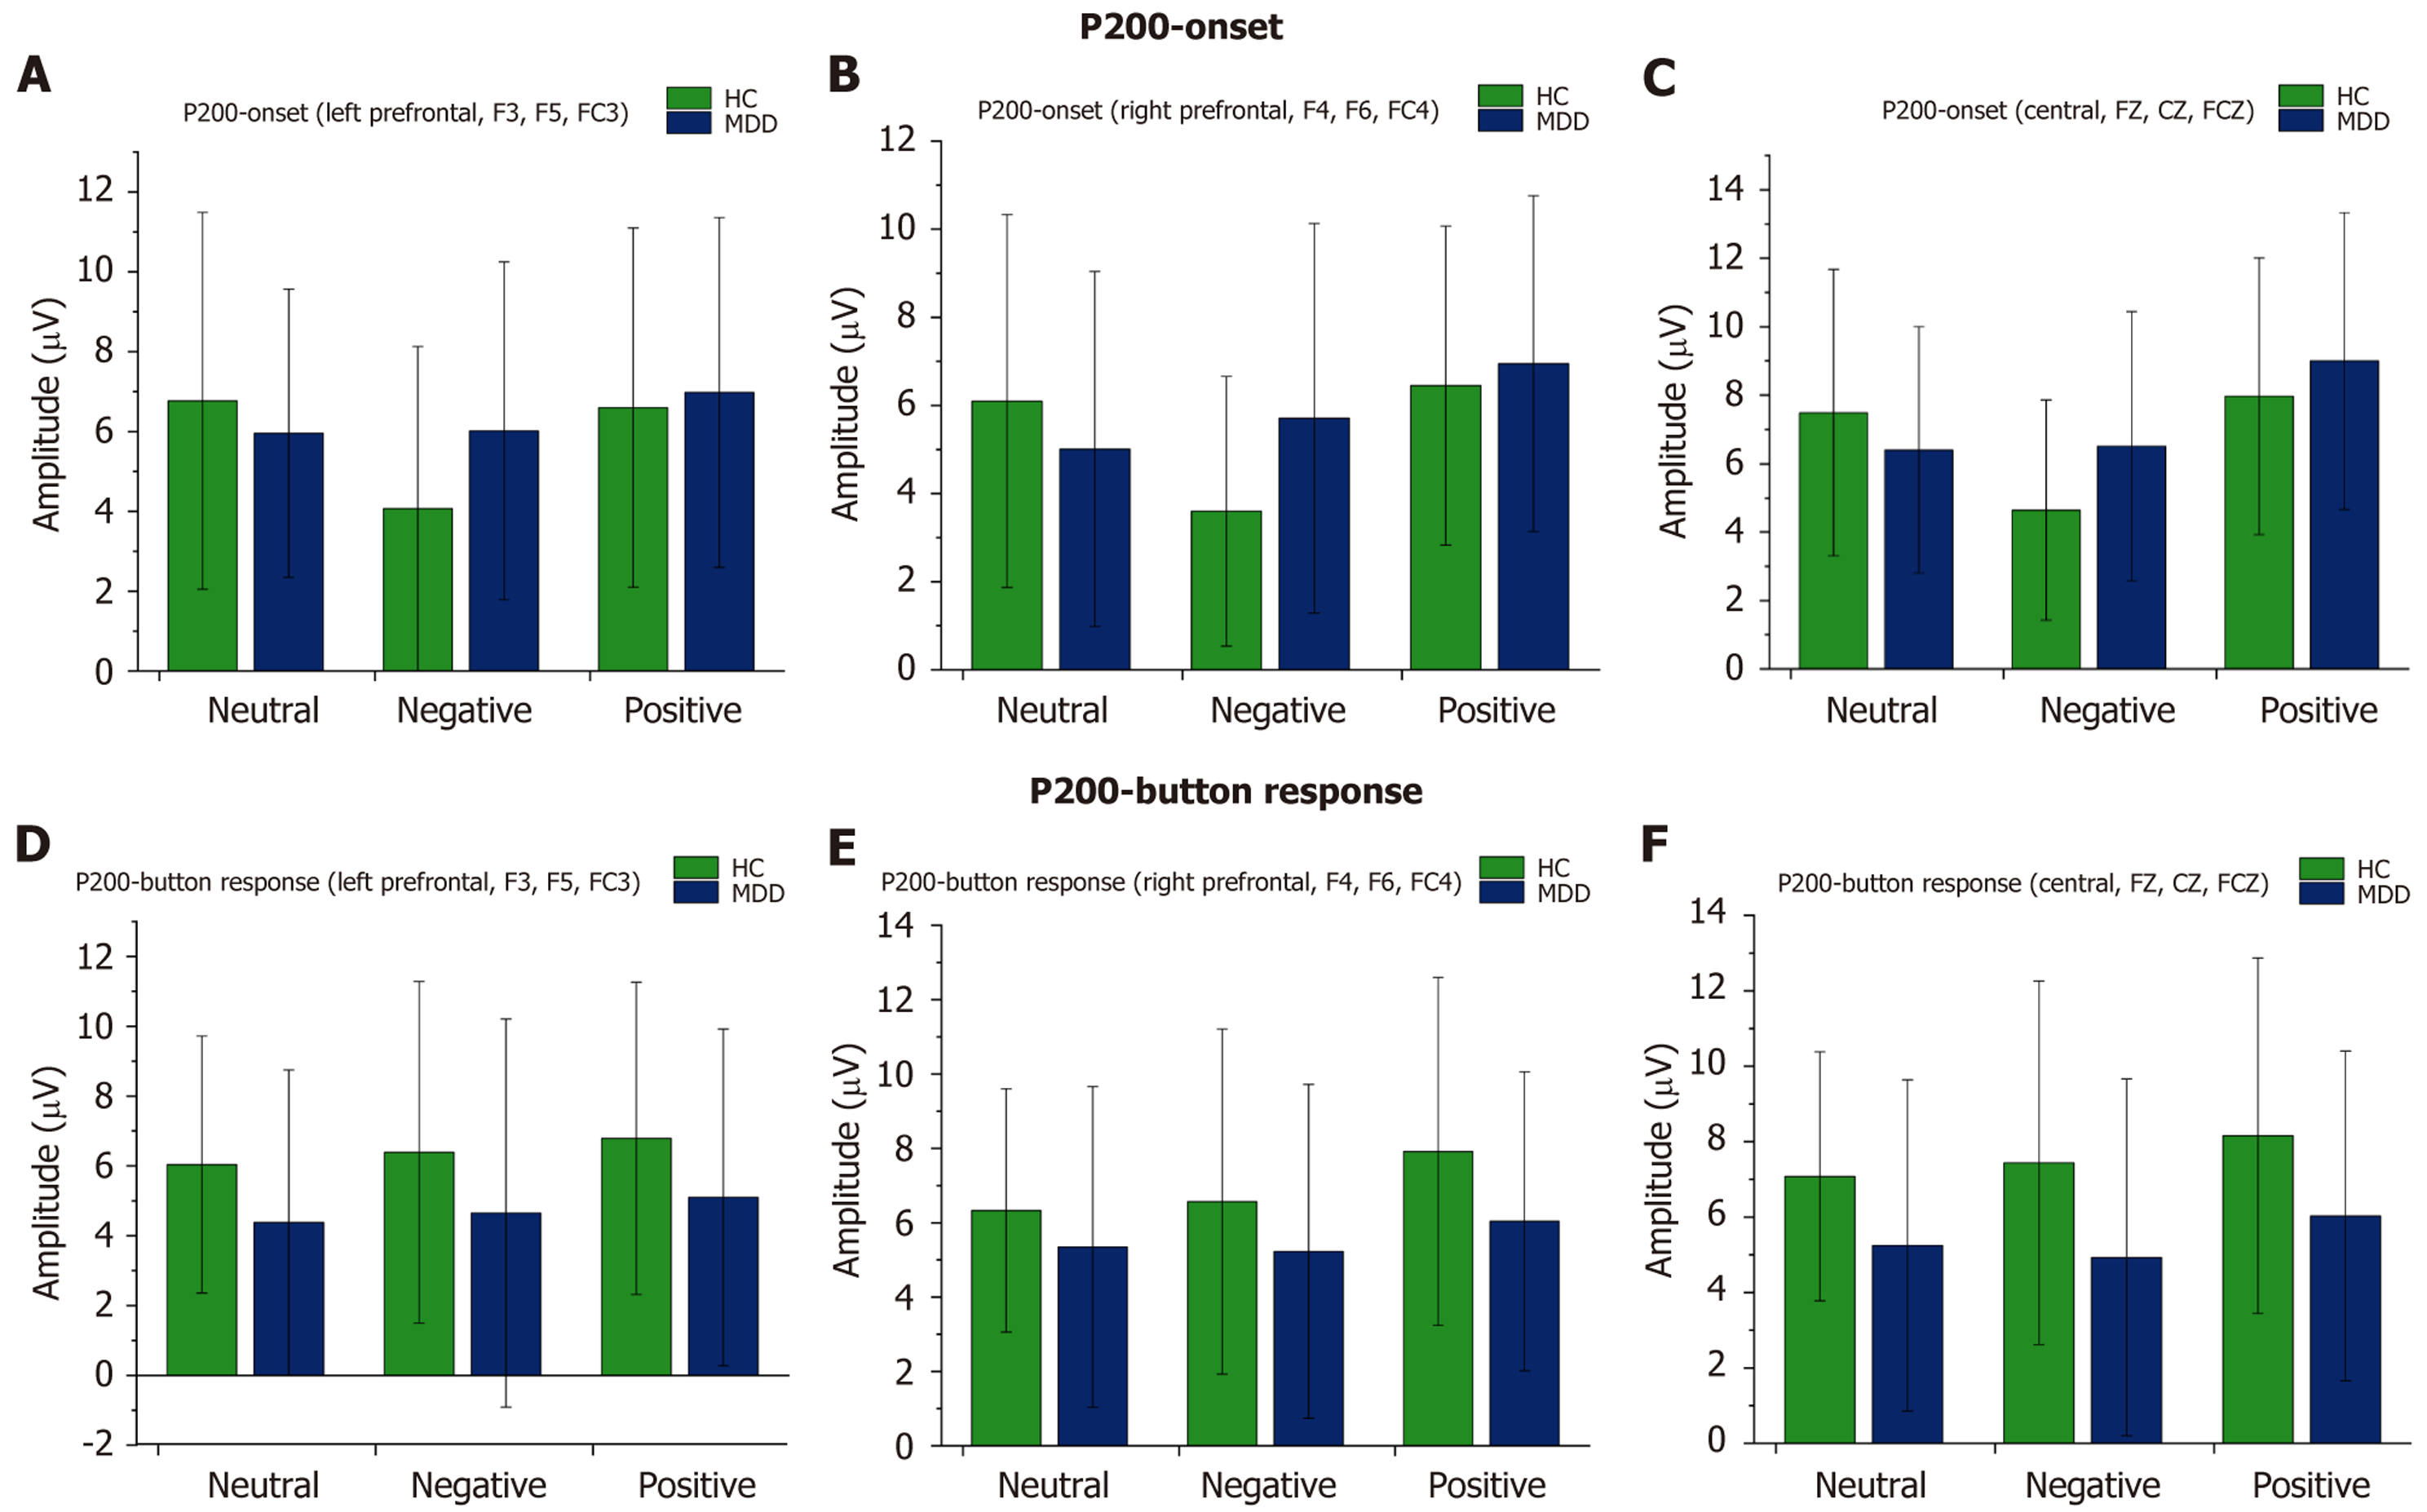
Figure 3 Amplitude distribution of the P200 event-related potential across stimulus onset and button-response phases.
A-C: Display the P200 amplitude across different electrode locations (left prefrontal, right prefrontal, central regions) and three stimulus types (neutral, negative, positive) during the stimulus onset phase; D-F: Illustrate the P200 amplitude at corresponding electrode locations and stimulus types during the button-response phase. Green bars represent the patient group, and dark blue bars represent the healthy control group; error bars indicate standard errors. MDD: Major depressive disorder; HC: Healthy control.
- Citation: He YN, Yang WY, Zhang J, Wang XY, Gao XZ, Liu XH, Zhou ZH. Neural correlates of impairments in music emotion processing in major depressive disorder: Evidenced from an event-related potential study. World J Psychiatry 2026; 16(6): 117245
- URL: https://www.wjgnet.com/2220-3206/full/v16/i6/117245.htm
- DOI: https://dx.doi.org/10.5498/wjp.v16.i6.117245