
















Copyright: ©Author(s) 2026.
World J Psychiatry. Jun 19, 2026; 16(6): 117245
Published online Jun 19, 2026. doi: 10.5498/wjp.v16.i6.117245
Published online Jun 19, 2026. doi: 10.5498/wjp.v16.i6.117245
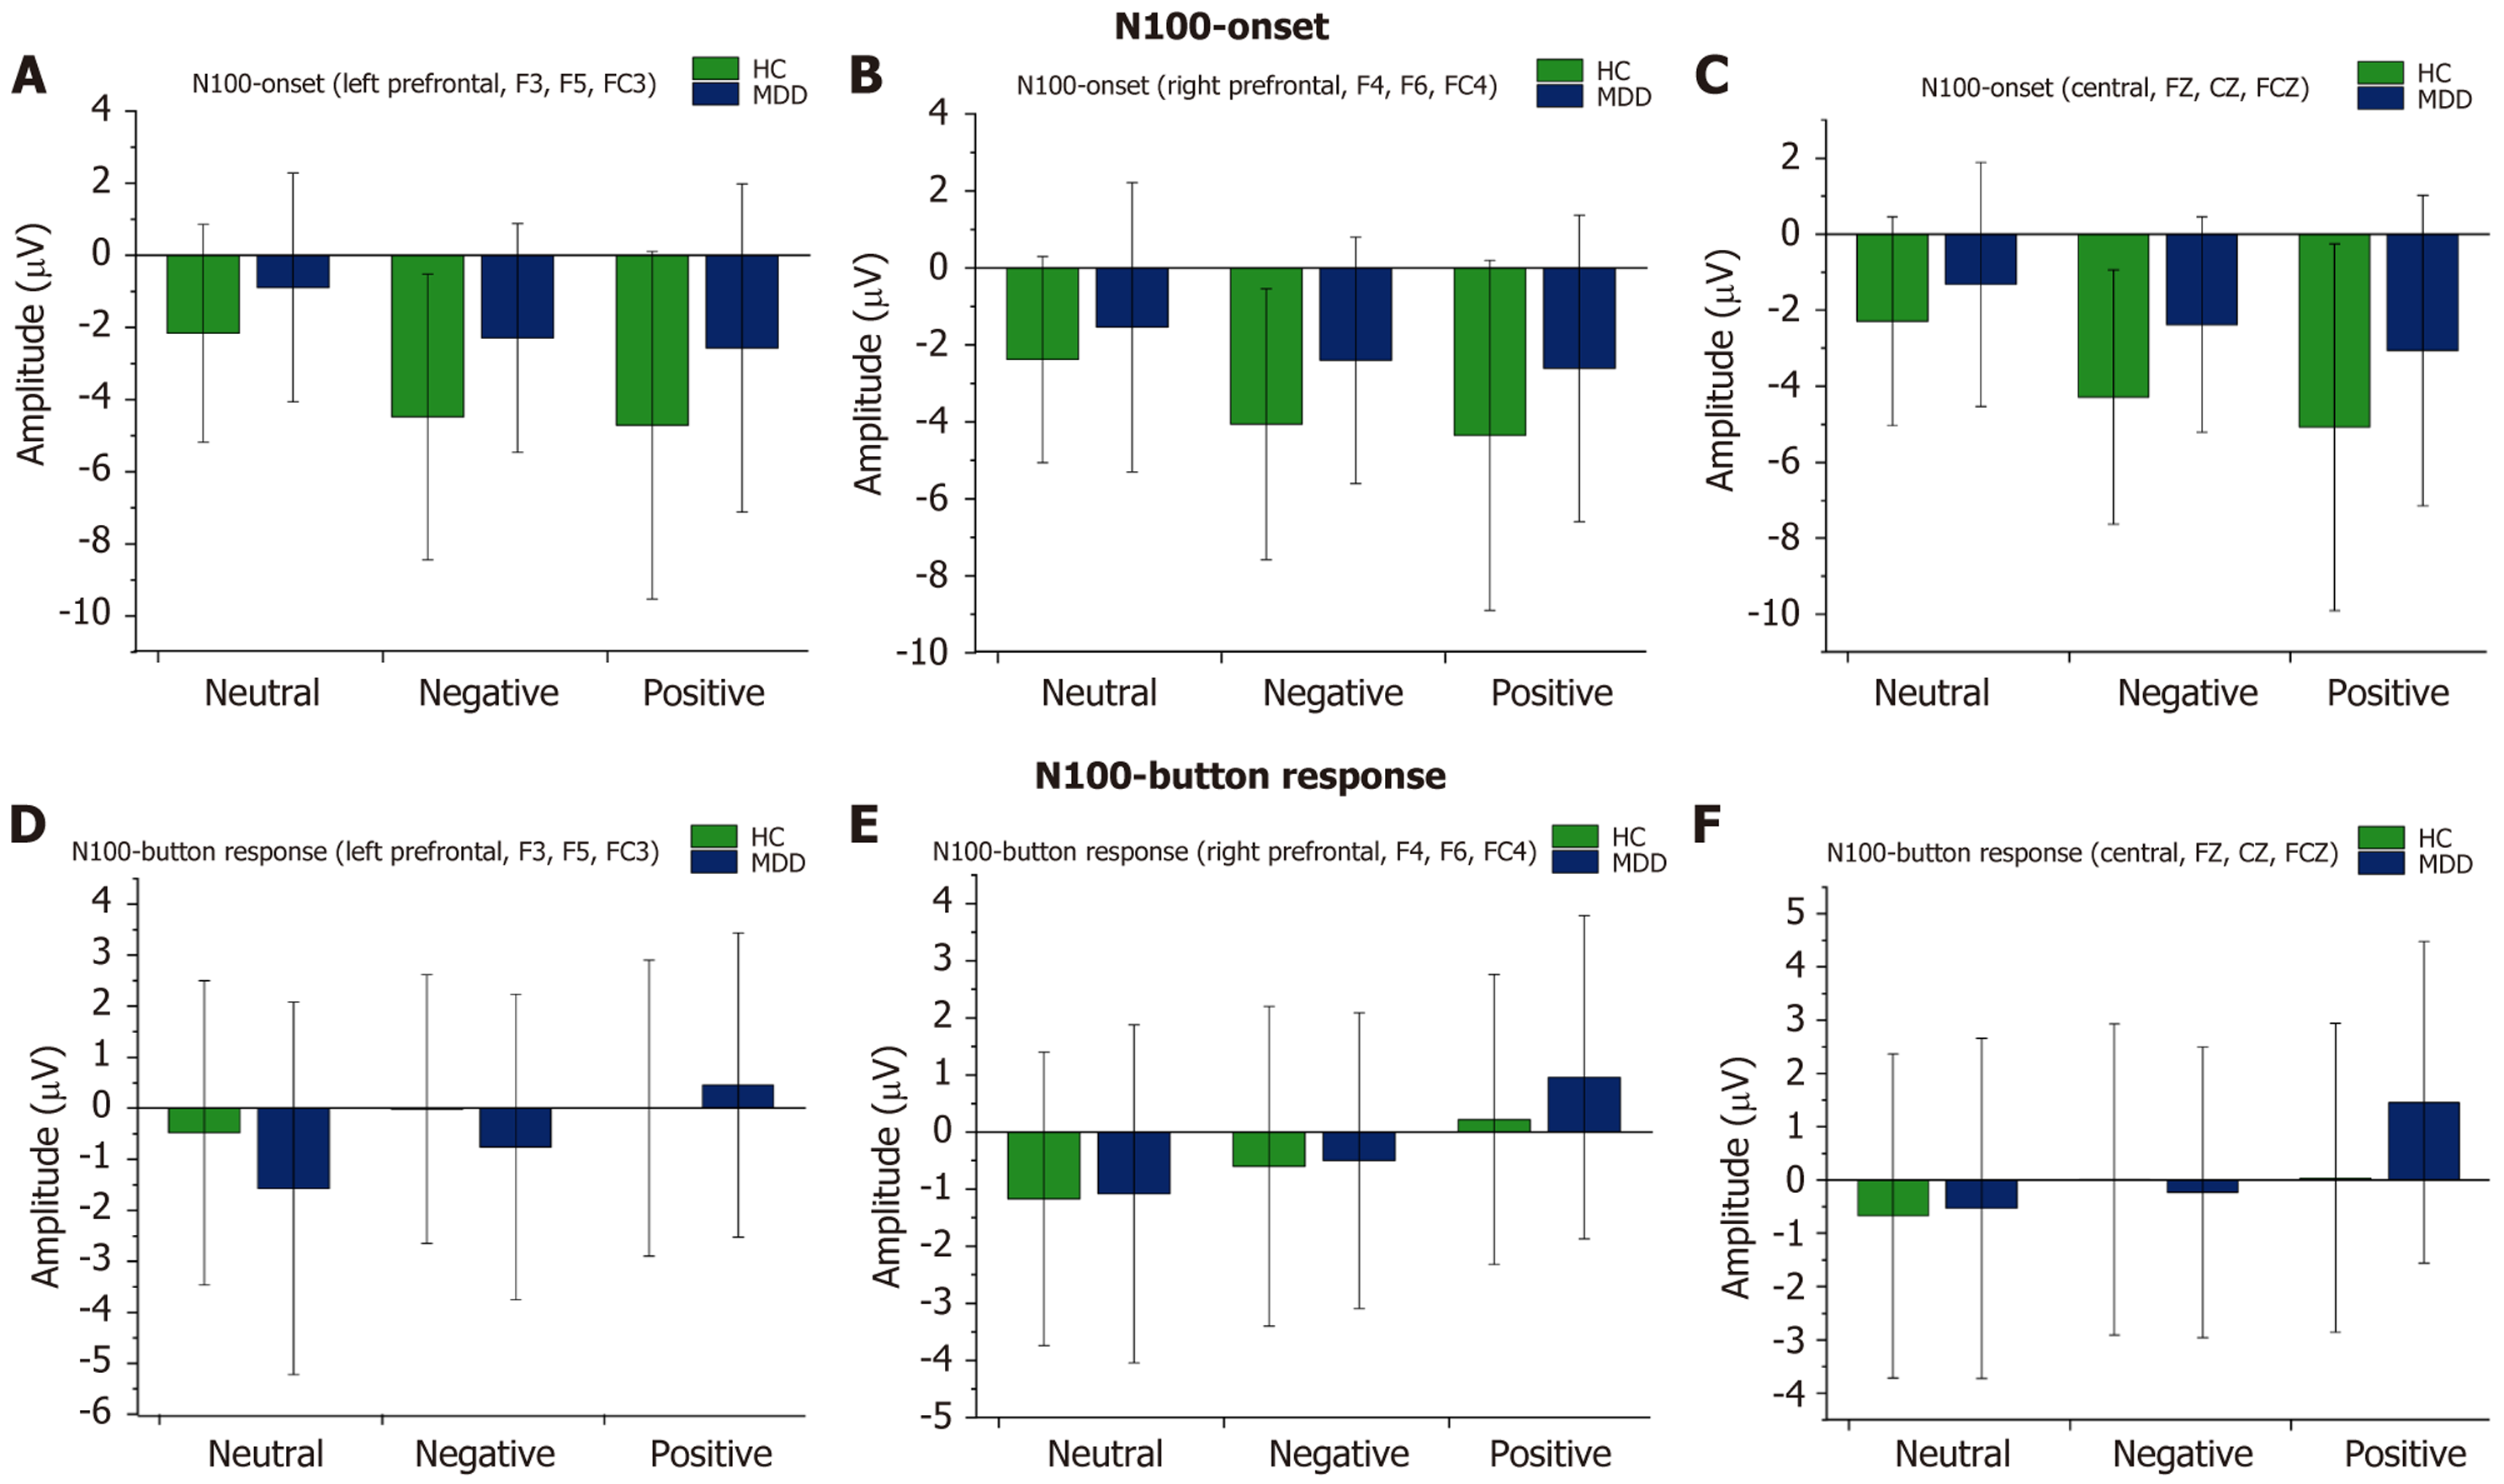
Figure 2 Amplitude differences of the N100 event-related potential during stimulus onset and button-response phases.
A-C: These panels illustrate the amplitude distribution of the N100 component across various electrode locations (left prefrontal, right prefrontal, central regions) and stimulus types (neutral, negative, positive) during the stimulus onset phase; D-F: Correspondingly, these panels present the N100 amplitude distribution across the same electrode locations and stimulus types during the button-response phase. Green bars represent the patient group, while dark blue bars represent the healthy control group. Error bars indicate standard errors. HC: Healthy control; MDD: Major depressive disorder.
- Citation: He YN, Yang WY, Zhang J, Wang XY, Gao XZ, Liu XH, Zhou ZH. Neural correlates of impairments in music emotion processing in major depressive disorder: Evidenced from an event-related potential study. World J Psychiatry 2026; 16(6): 117245
- URL: https://www.wjgnet.com/2220-3206/full/v16/i6/117245.htm
- DOI: https://dx.doi.org/10.5498/wjp.v16.i6.117245