
















Copyright: ©Author(s) 2026.
World J Psychiatry. Jun 19, 2026; 16(6): 117066
Published online Jun 19, 2026. doi: 10.5498/wjp.v16.i6.117066
Published online Jun 19, 2026. doi: 10.5498/wjp.v16.i6.117066
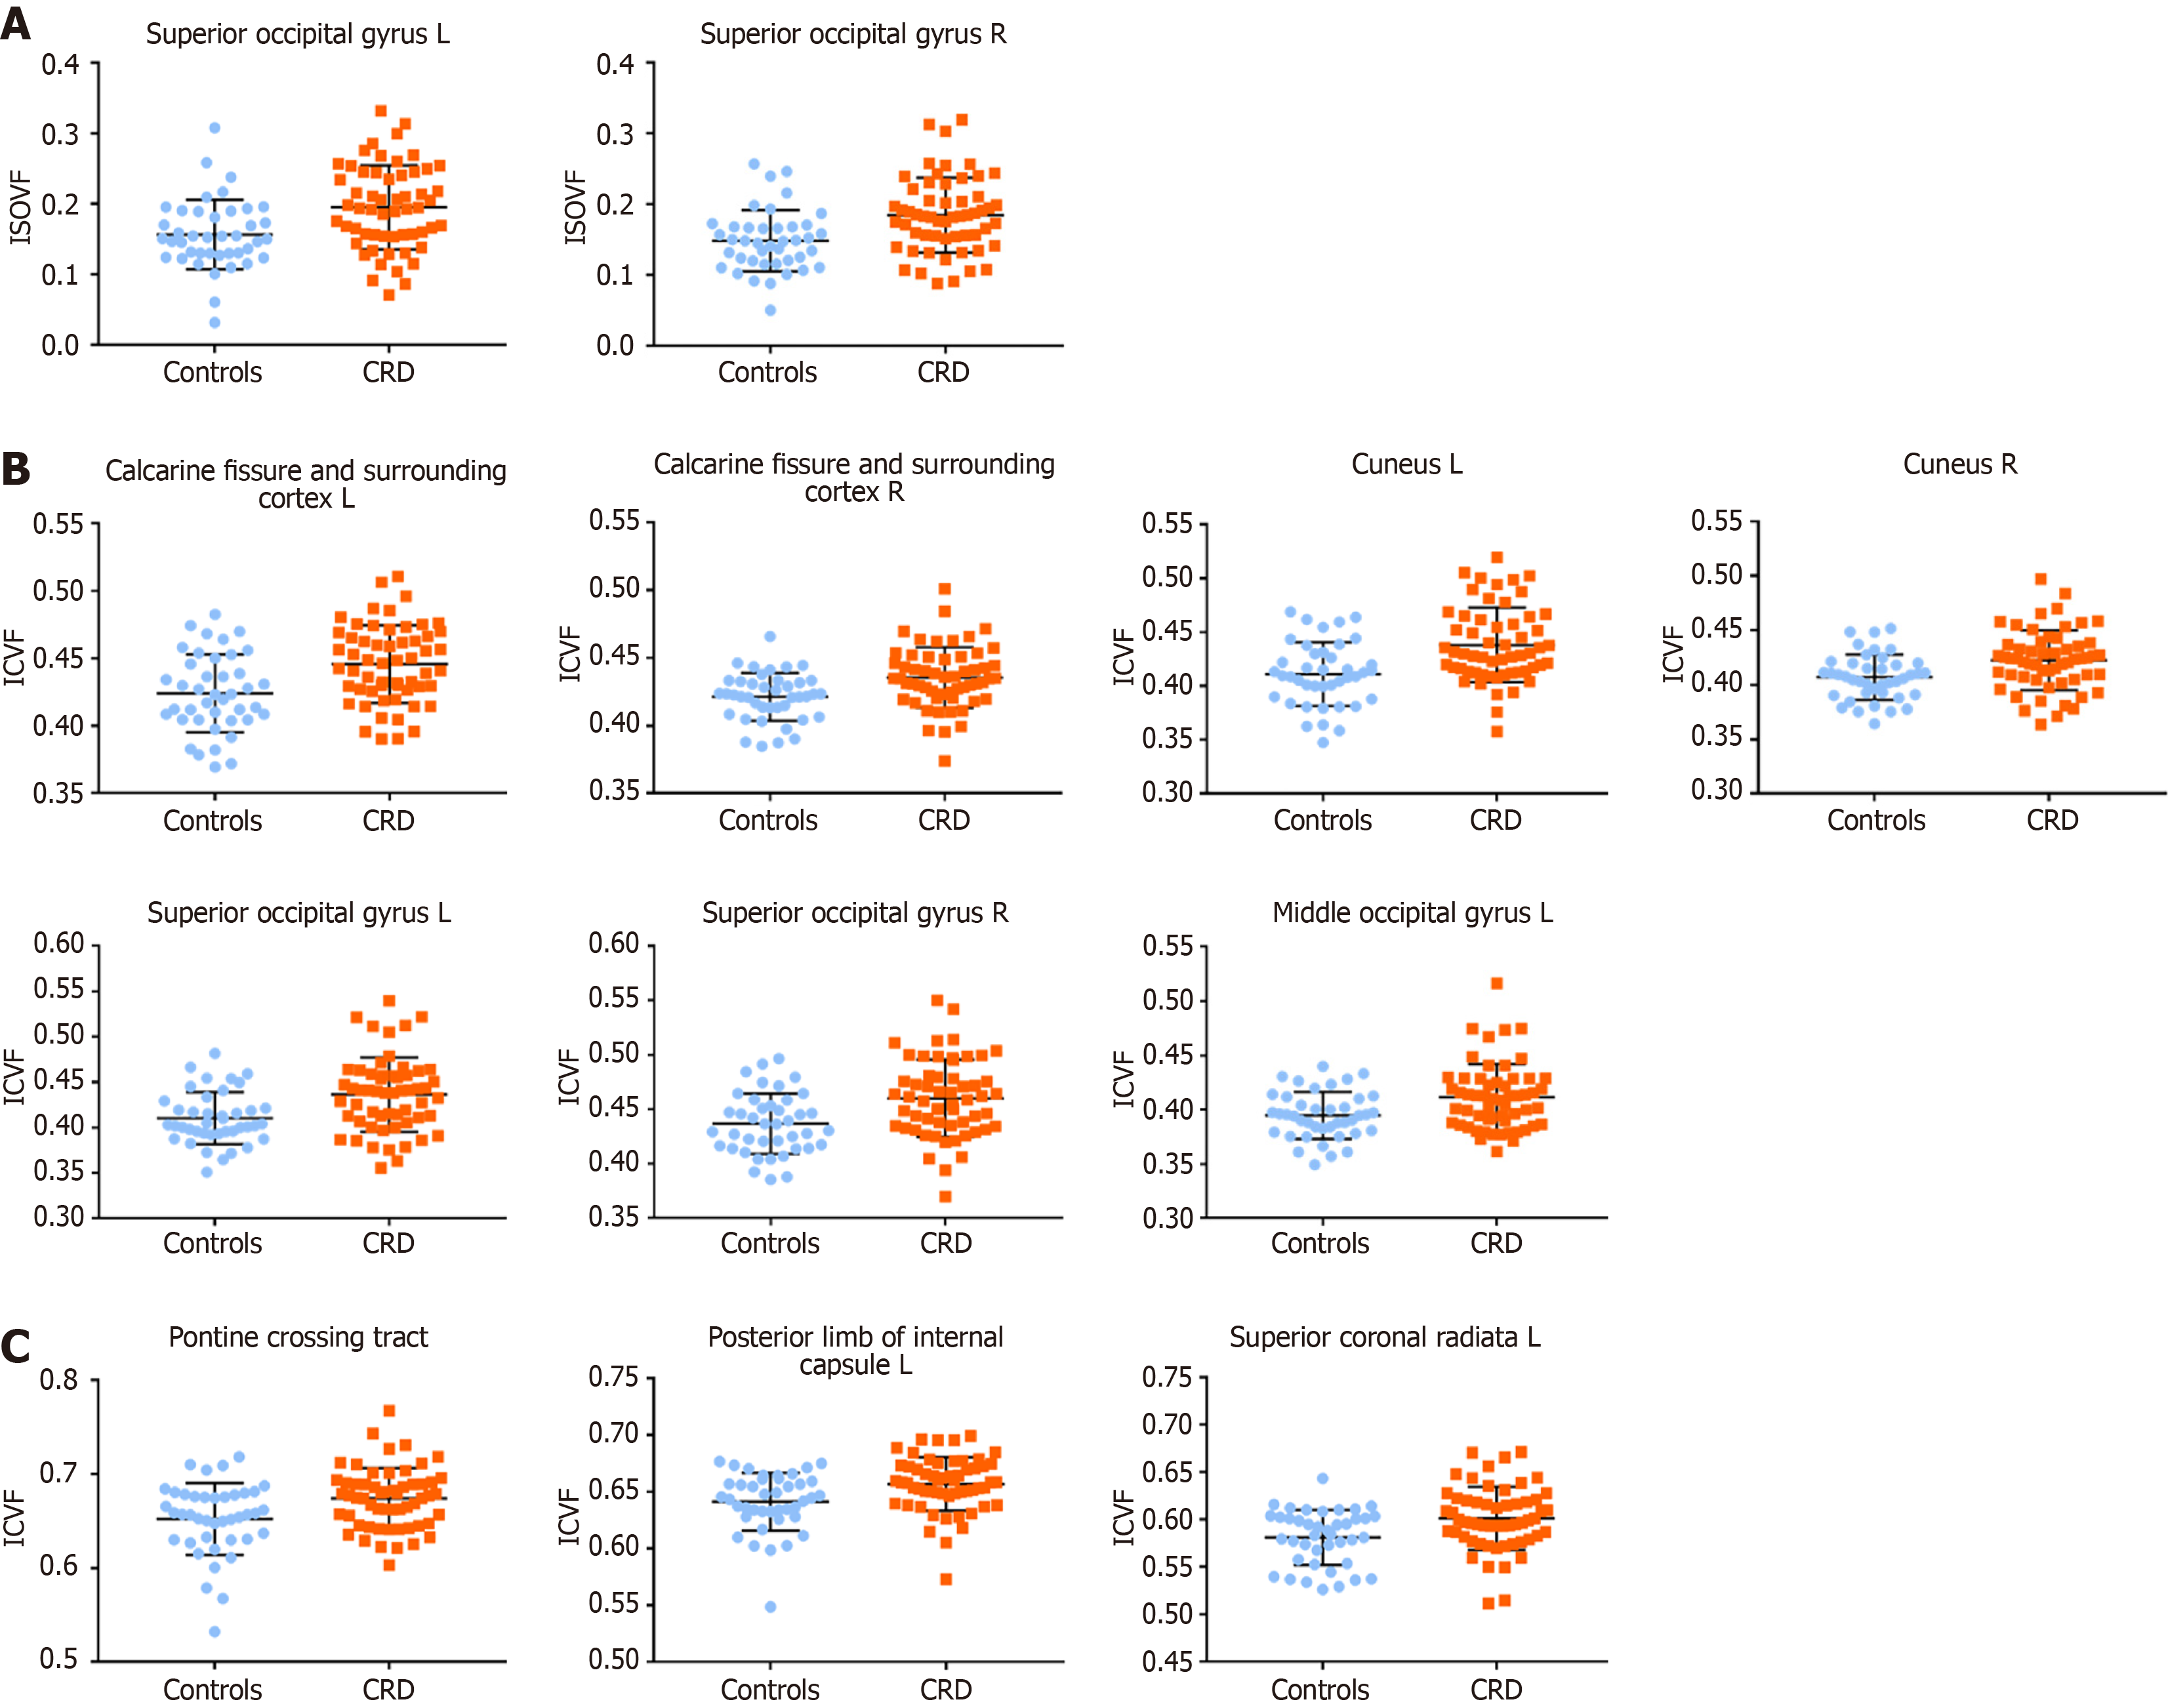
Figure 3 Scatter Plot illustrating significant differences in volume fraction of the isotropically diffusing water and intracellular volume fraction of gray/white matter values between the circadian rhythm disruption and control groups.
A: Volume fraction of the isotropically diffusing water differences in gray matter: Left superior occipital gyrus, right superior occipital gyrus; B: Intracellular volume fraction (ICVF) differences in gray matter: Left calcarine fissure and surrounding cortex, right calcarine fissure and surrounding cortex, left cuneus, right cuneus, left superior occipital gyrus, right superior occipital gyrus, left middle occipital gyrus; C: ICVF differences in white matter tract: Pontine crossing tract, left posterior limb of the internal capsule, left superior coronal radiata. L: Left; R: Right; ISOVF: Volume fraction of the isotropically diffusing water; ICVF: Intracellular volume fraction; CRD: Circadian rhythm disruption.
- Citation: Zhang F, Huang WY, Zhang L, Huang ZR, Zhao W, Yu YQ. Circadian rhythm disruption alters gray and white matter microstructure: Higher-order diffusion analysis coupled with hormonal/inflammatory biomarkers. World J Psychiatry 2026; 16(6): 117066
- URL: https://www.wjgnet.com/2220-3206/full/v16/i6/117066.htm
- DOI: https://dx.doi.org/10.5498/wjp.v16.i6.117066