
















Copyright: ©Author(s) 2026.
World J Psychiatry. Jun 19, 2026; 16(6): 115996
Published online Jun 19, 2026. doi: 10.5498/wjp.v16.i6.115996
Published online Jun 19, 2026. doi: 10.5498/wjp.v16.i6.115996
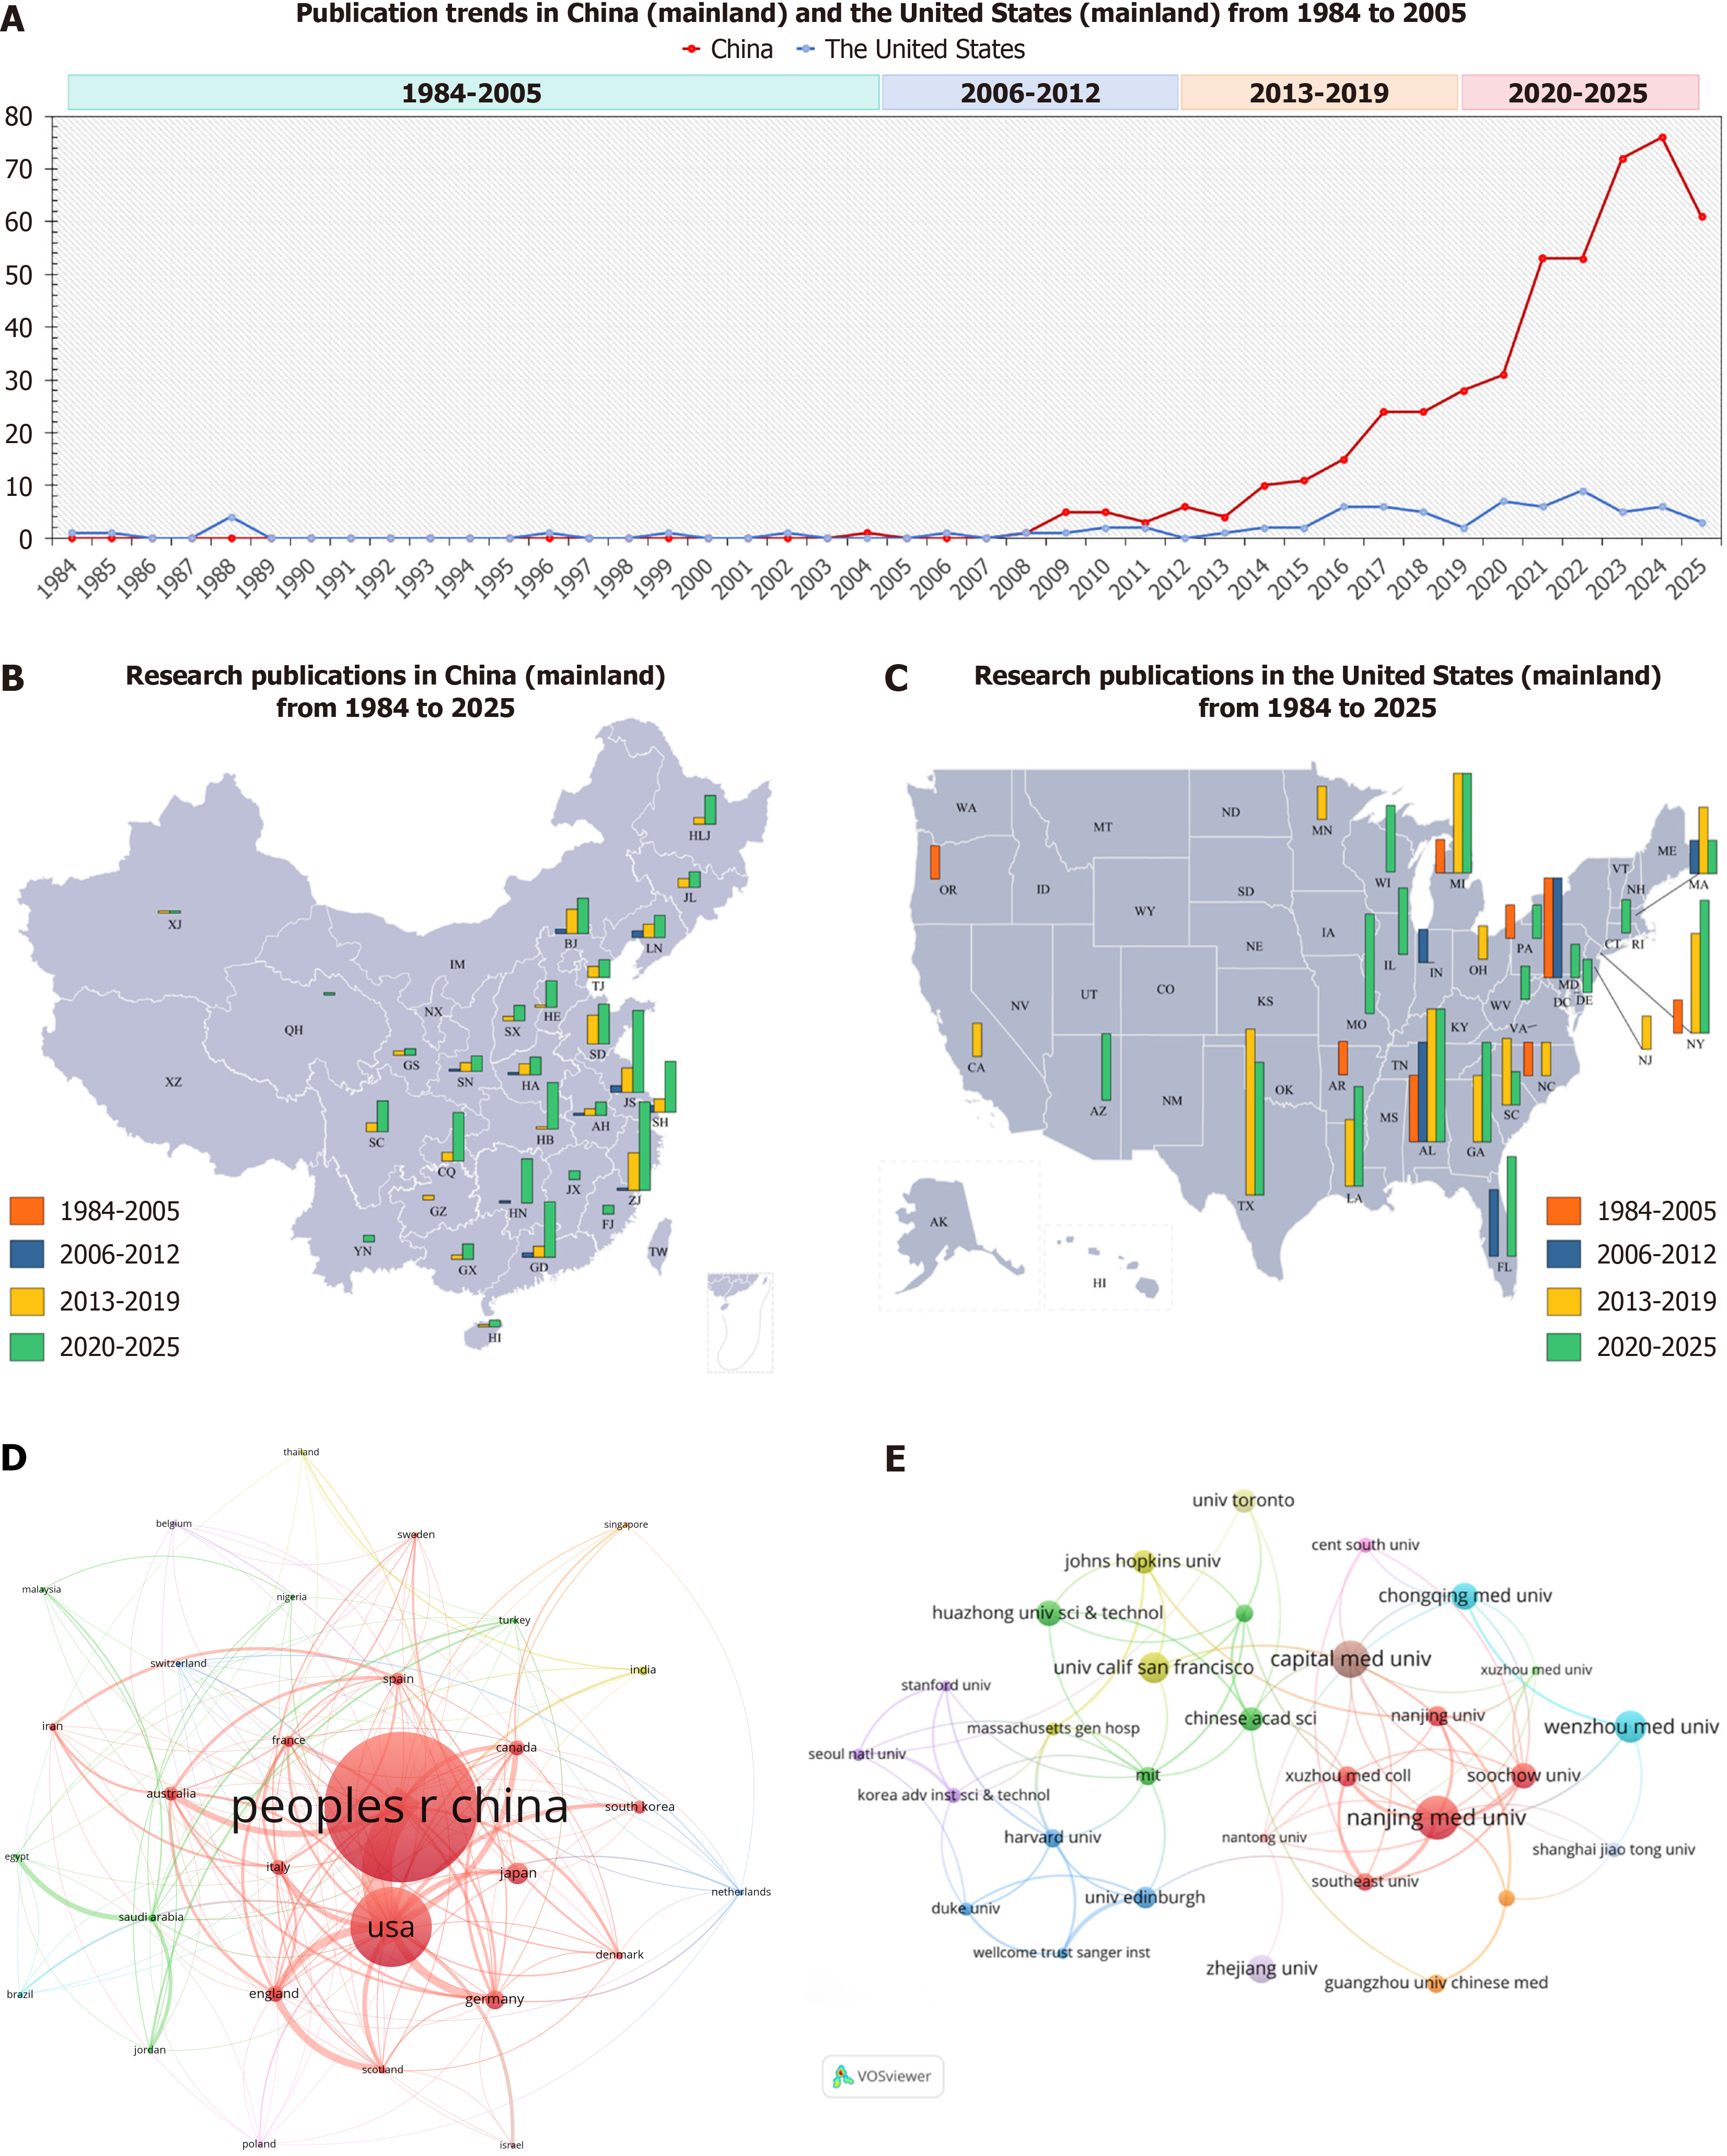
Figure 2 Comparative bibliometric analysis of post-stroke depression research between China (mainland) and the United States (mainland) (1984-2025).
A: Annual publication trends (1984-2025). A line graph comparing the yearly number of post-stroke depression (PSD)-related publications from China (mainland, red solid line) and the United States (mainland, blue dashed line). The timeline is divided into four phases (1984-2005, 2006-2012, 2013-2019, 2020-2025) to reflect distinct periods of research policy and investment. China shows exponential growth after 2010, peaking around 2023, whereas United States output remains relatively stable; B: Geographical distribution of publications in China (mainland). A choropleth-bar map illustrating provincial-level research output across four time periods. Each province is marked by a cluster of vertical bars color-coded by period: Red (1984-2005), blue (2006-2012), yellow (2013-2019), and green (2020-2025). Bar height corresponds to publication count. High-output provinces include Jiangsu, Beijing, Shanghai, Guangdong, and Zhejiang, with pronounced growth in the most recent period. Regions such as Tibet and Qinghai show minimal activity; C: Geographical distribution of publications in the United States (mainland). A corresponding choropleth-bar map for United States, using the same period-based color scheme. States with the highest research output include California, Massachusetts, New York, Illinois, and Texas, reflecting established regional research hubs; D: International collaboration network. A node-link diagram generated with VOSviewer, displaying co-authorship links between countries. Node size represents publication volume, and link thickness indicates collaboration strength. China (“peoples r China”) and the United States (“USA”) are the largest and most central nodes, connected to numerous other countries (e.g., Thailand, Belgium), underscoring their pivotal roles in global PSD research networks; E: Institutional collaboration network. A detailed network map highlighting cooperative relationships among major research institutions. Nodes represent institutions (e.g., Harvard University, Stanford University, MIT in the United States; Chinese Academy of Sciences, Nanjing Medical University in China), colored by country/region. Links denote co-authorship, with thicker lines indicating stronger collaboration. The network reveals both domestic clusters and cross-national partnerships, illustrating the complex, globally interconnected nature of PSD research. Analyses were performed using CiteSpace (6.3.R1), VOSviewer (1.6.20), Origin (2025), and Excel (2025).
- Citation: Gu JX, Liu CQ, Chen GX, Yao T, Sun ZX, Wang Y. Post-stroke depression update 2025: Mechanisms, prediction, and management. World J Psychiatry 2026; 16(6): 115996
- URL: https://www.wjgnet.com/2220-3206/full/v16/i6/115996.htm
- DOI: https://dx.doi.org/10.5498/wjp.v16.i6.115996