
















Copyright: ©Author(s) 2026.
World J Psychiatry. Jun 19, 2026; 16(6): 114616
Published online Jun 19, 2026. doi: 10.5498/wjp.v16.i6.114616
Published online Jun 19, 2026. doi: 10.5498/wjp.v16.i6.114616
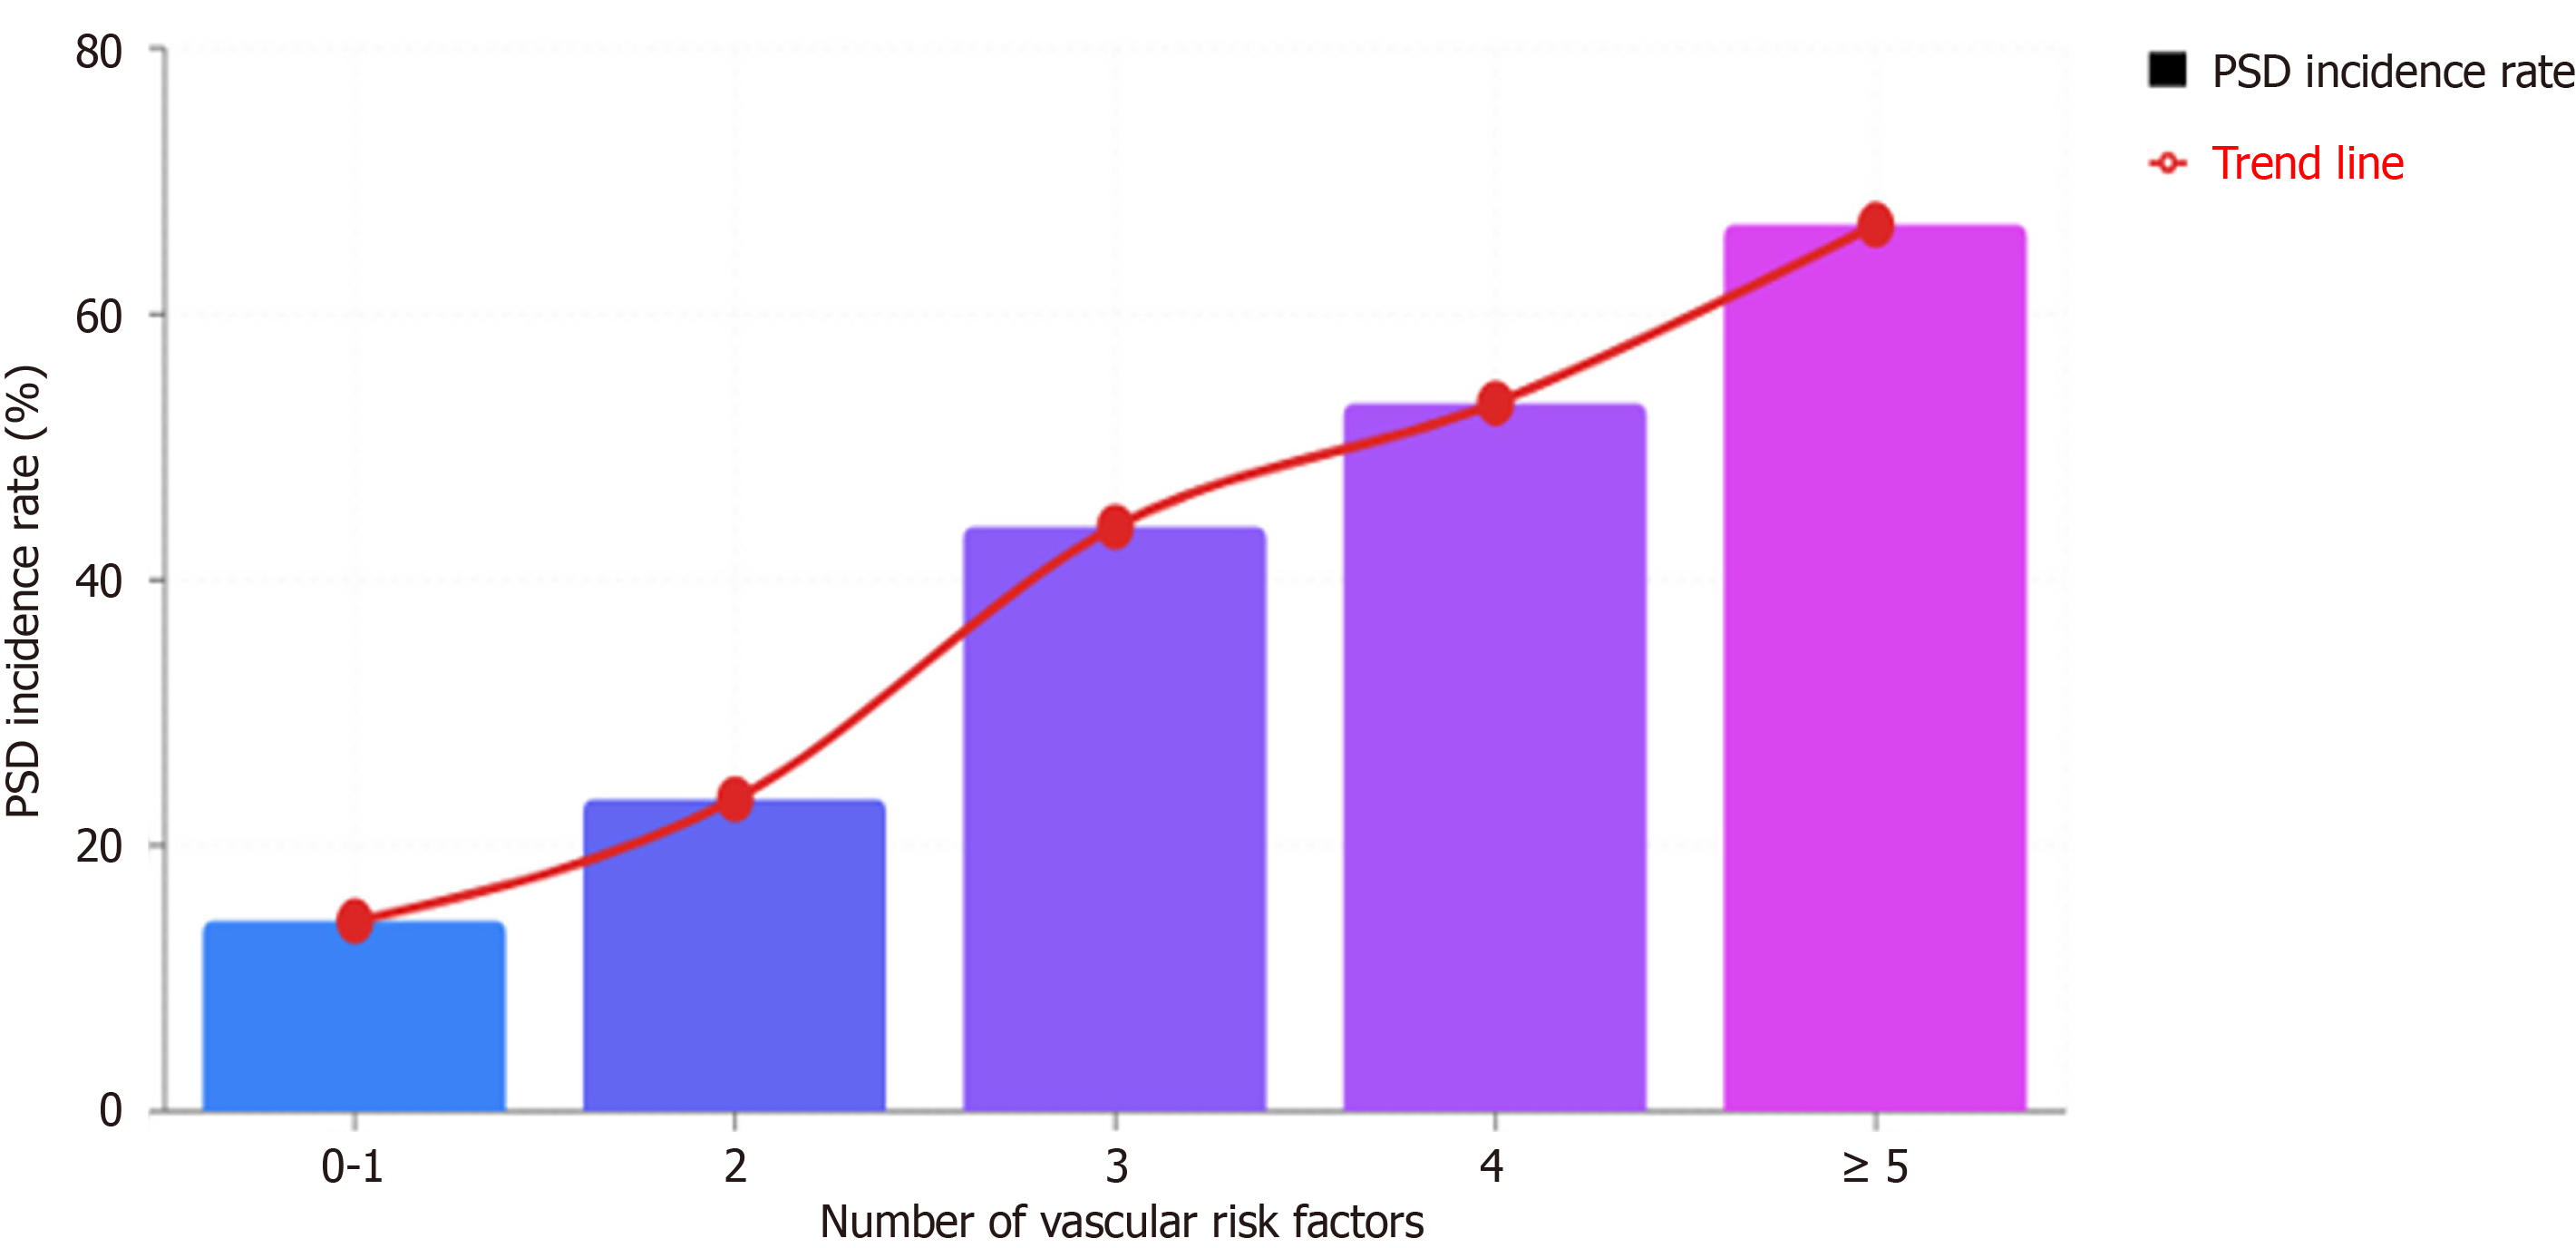
Figure 3 Relationship between the number of vascular risk factors and post-stroke depression incidence rate.
The bar chart shows post-stroke depression incidence rate percentages corresponding to different numbers of vascular risk factors. The red trend line indicates a linear increase in post-stroke depression incidence rate as the number of risk factors increases. PSD: Post-stroke depression.
- Citation: Zhao JD, Yu CW, Lin KY, Huang JL, Qiu SW. Association between vascular risk factor clustering and post-stroke depression. World J Psychiatry 2026; 16(6): 114616
- URL: https://www.wjgnet.com/2220-3206/full/v16/i6/114616.htm
- DOI: https://dx.doi.org/10.5498/wjp.v16.i6.114616