
















Copyright: ©Author(s) 2026.
World J Psychiatry. Jun 19, 2026; 16(6): 114616
Published online Jun 19, 2026. doi: 10.5498/wjp.v16.i6.114616
Published online Jun 19, 2026. doi: 10.5498/wjp.v16.i6.114616
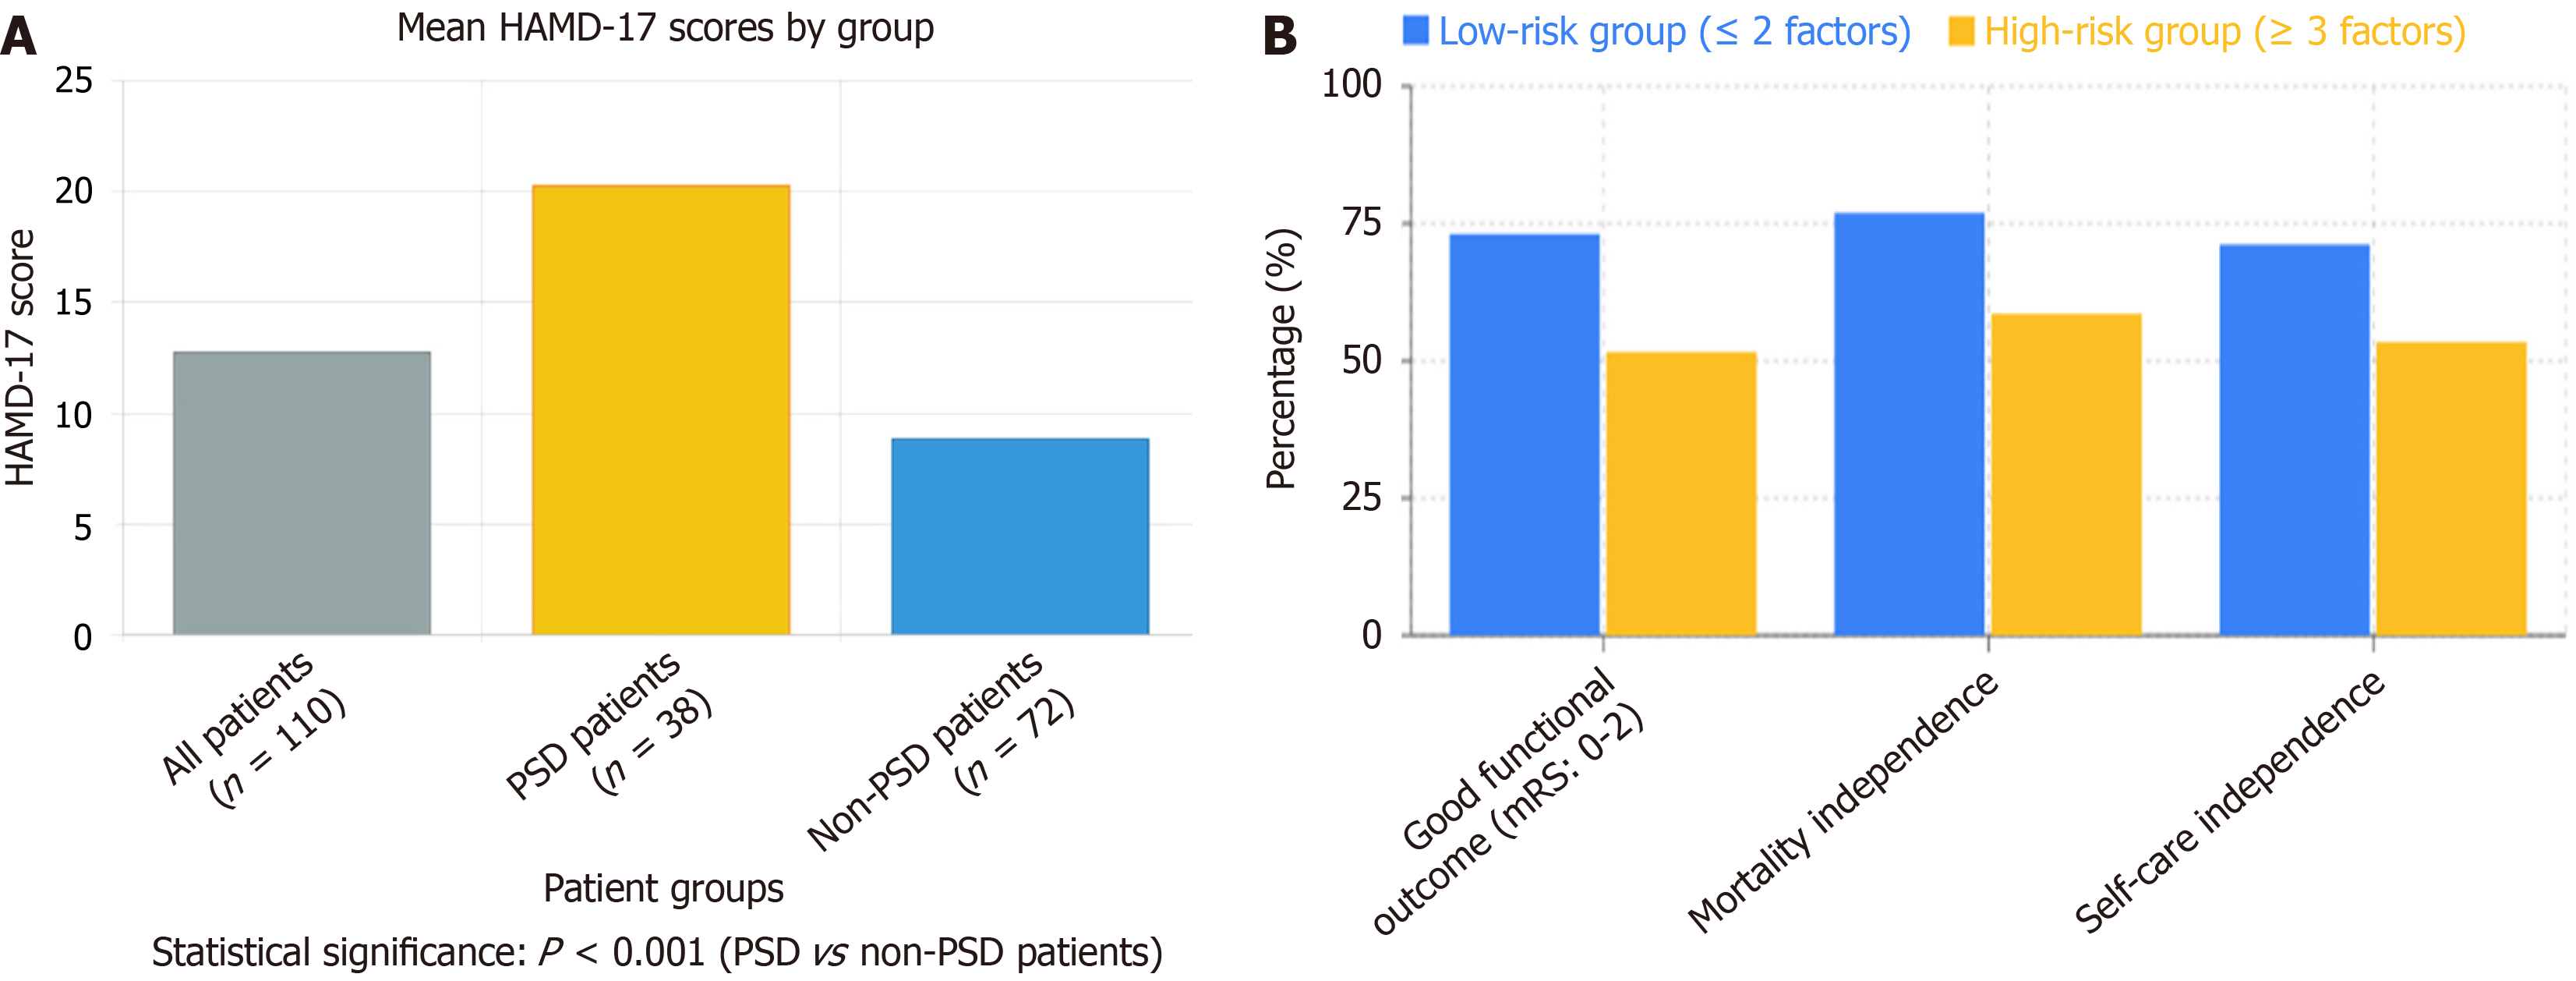
Figure 1 Comparison of different groups.
A: Comparison of Hamilton Depression Rating Scale-17 scores among different patient groups. Post-stroke depression (PSD) patients had significantly higher mean scores (20.3 ± 3.2 points) compared to non-depressed patients (8.9 ± 2.8 points) and all patients overall (12.8 ± 5.4 points). Statistical analysis revealed a highly significant difference between PSD and non-PSD groups (P < 0.001). Sample sizes: Total patients, n = 110, PSD patients, n = 38, non-PSD patients, n = 72; B: Comparison of functional assessment indicators between different risk groups. Blue bars represent the low-risk group (≤ 2 risk factors), and orange bars represent the high-risk group (≥ 3 risk factors). The Y-axis shows the percentage scores for each functional assessment. Data demonstrate that the low-risk group significantly outperformed the high-risk group in gait function, mobility independence, and self-care independence. HAMD-17: Hamilton Depression Rating Scale-17; PSD: Post-stroke depression; mRS: Modified Rankin Scale.
- Citation: Zhao JD, Yu CW, Lin KY, Huang JL, Qiu SW. Association between vascular risk factor clustering and post-stroke depression. World J Psychiatry 2026; 16(6): 114616
- URL: https://www.wjgnet.com/2220-3206/full/v16/i6/114616.htm
- DOI: https://dx.doi.org/10.5498/wjp.v16.i6.114616