
















Copyright: ©Author(s) 2026.
World J Psychiatry. Jun 19, 2026; 16(6): 114553
Published online Jun 19, 2026. doi: 10.5498/wjp.v16.i6.114553
Published online Jun 19, 2026. doi: 10.5498/wjp.v16.i6.114553
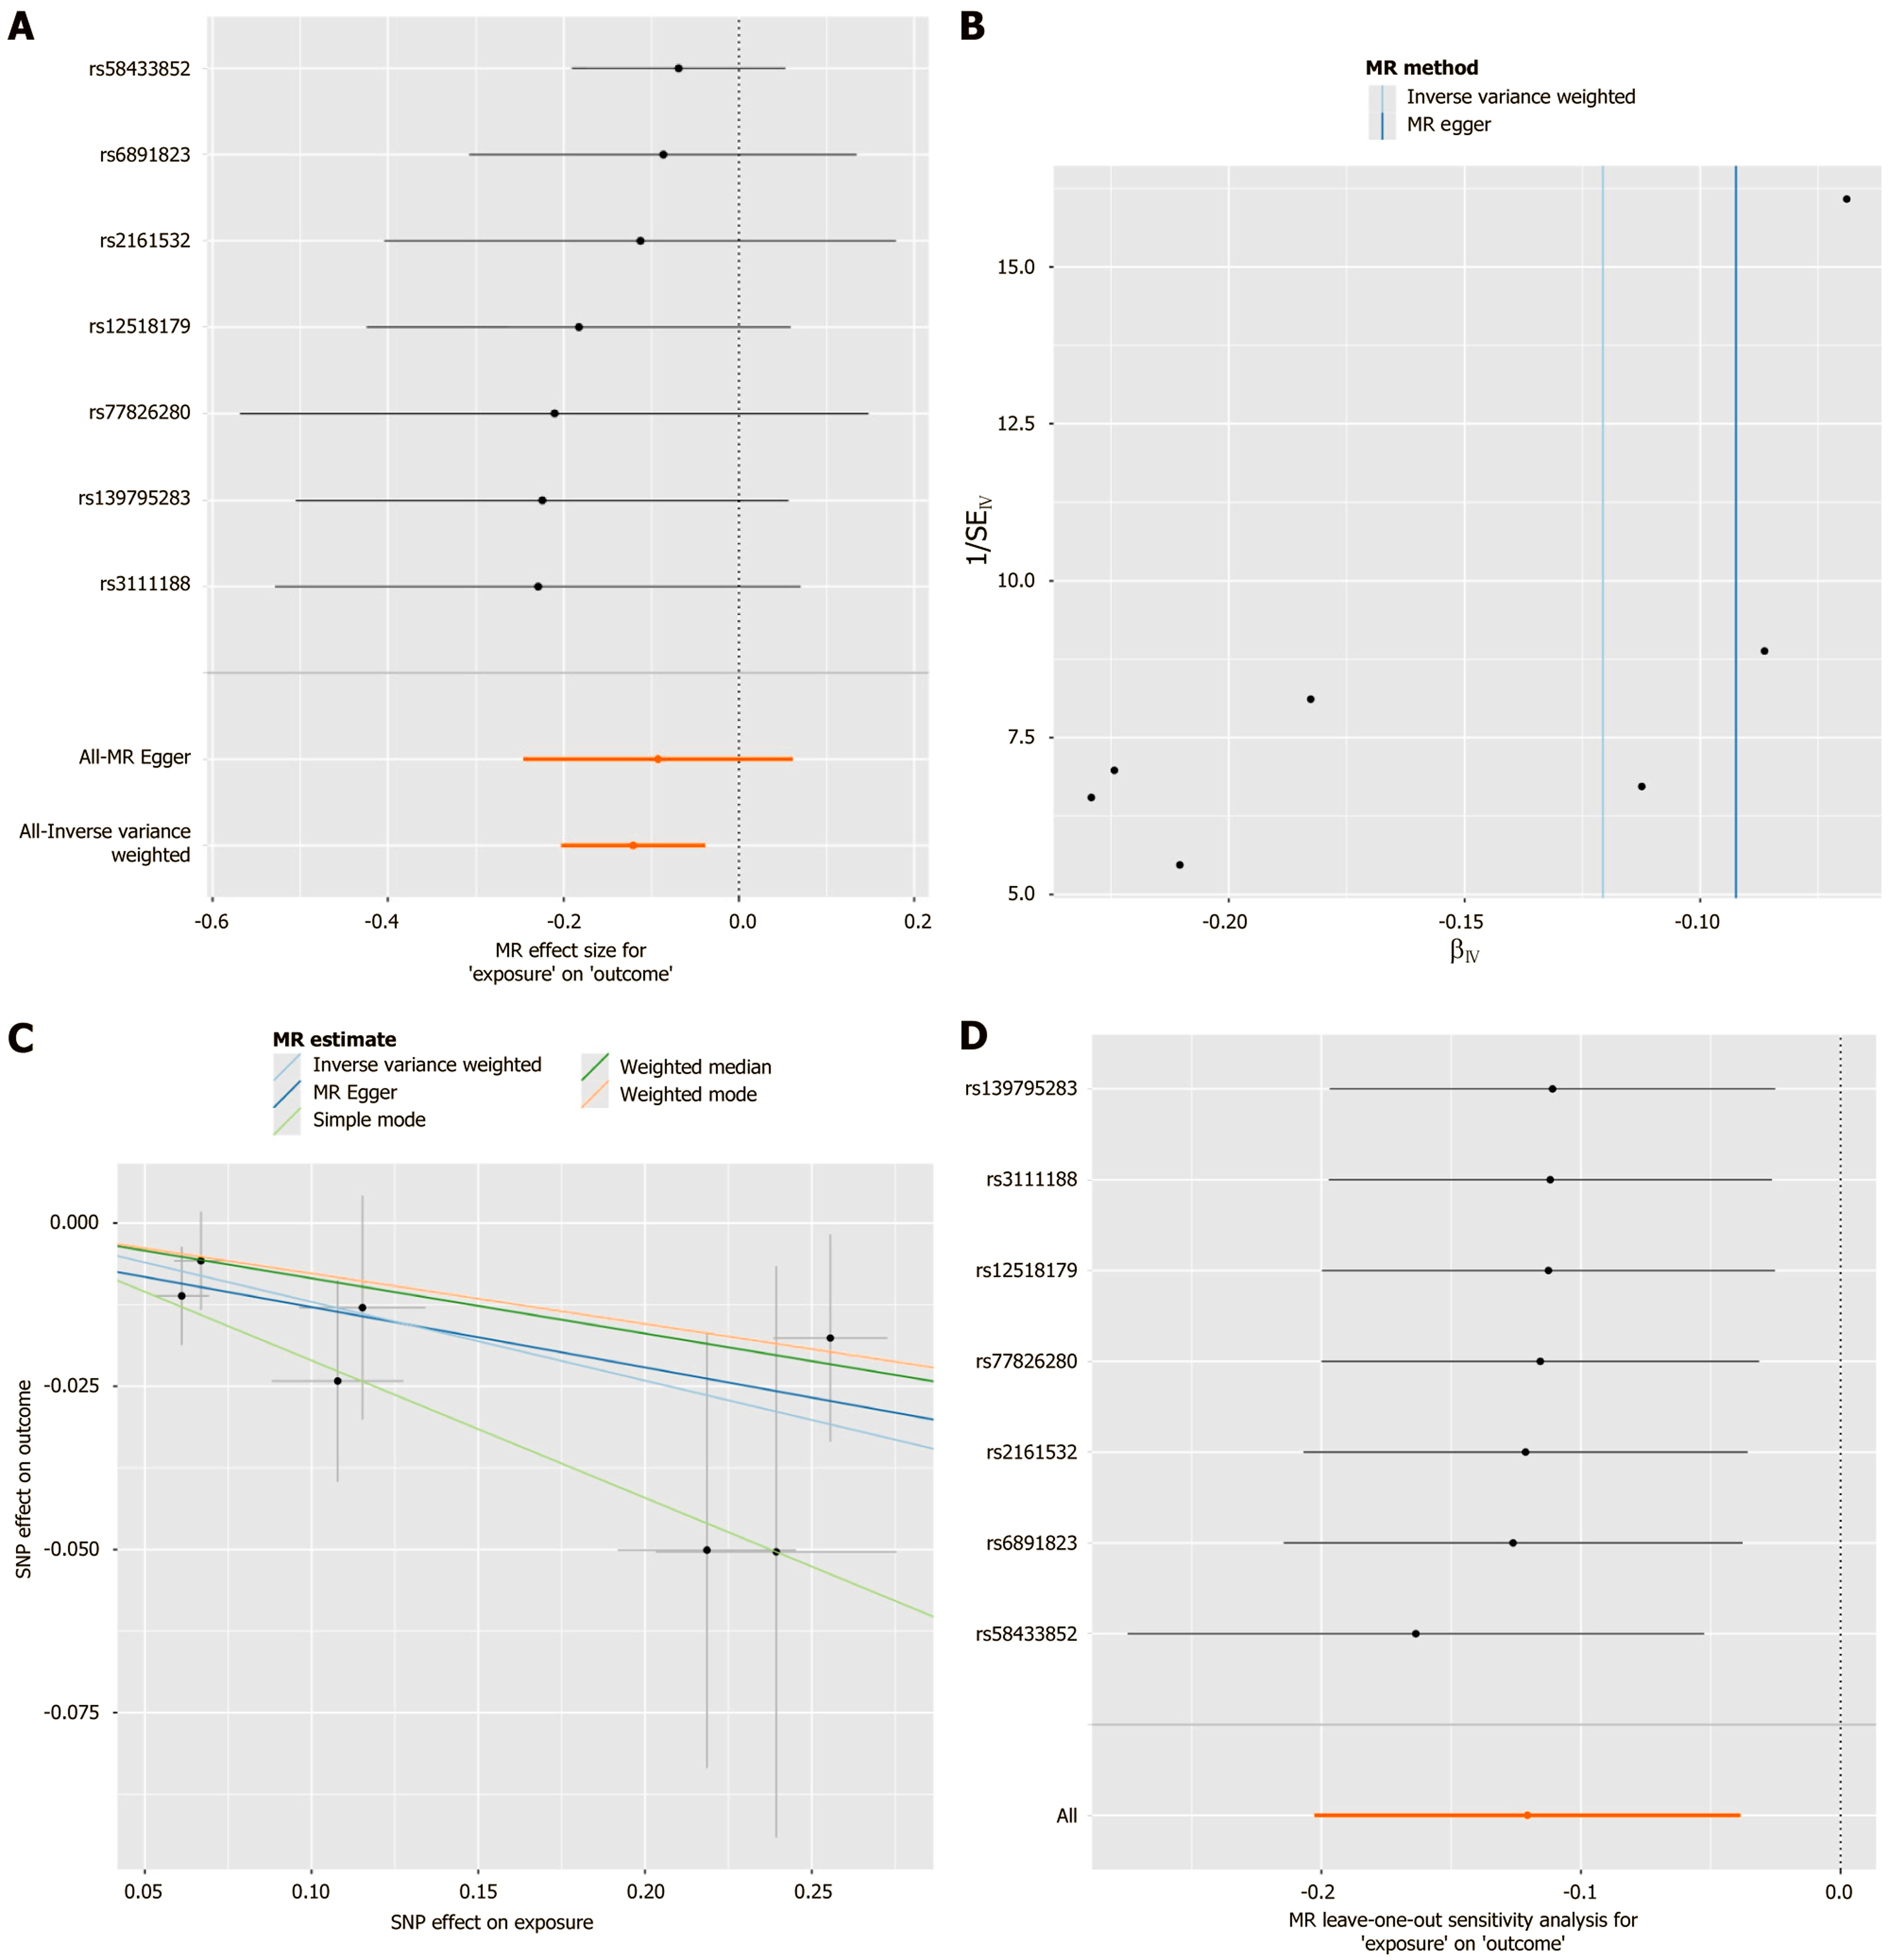
Figure 8 Mendelian randomization analysis results of GZMA and depression.
A: Forest plot of Mendelian randomization (MR). The forest plot showed that most single nucleotide polymorphism effects were located to the left of the line of no effect, suggesting that up-regulation of GZMA reduced the risk of dep
- Citation: Zhong J, Chen W, Li S, Zheng DL, Wang YD, Huang JH, Liang XQ, Liang MK. Exploring the antidepressant mechanisms of Guipi pill: A focus on gut-brain axis and immunity modulation. World J Psychiatry 2026; 16(6): 114553
- URL: https://www.wjgnet.com/2220-3206/full/v16/i6/114553.htm
- DOI: https://dx.doi.org/10.5498/wjp.v16.i6.114553