















Copyright: ©Author(s) 2026.
World J Psychiatry. Jun 19, 2026; 16(6): 113229
Published online Jun 19, 2026. doi: 10.5498/wjp.v16.i6.113229
Published online Jun 19, 2026. doi: 10.5498/wjp.v16.i6.113229
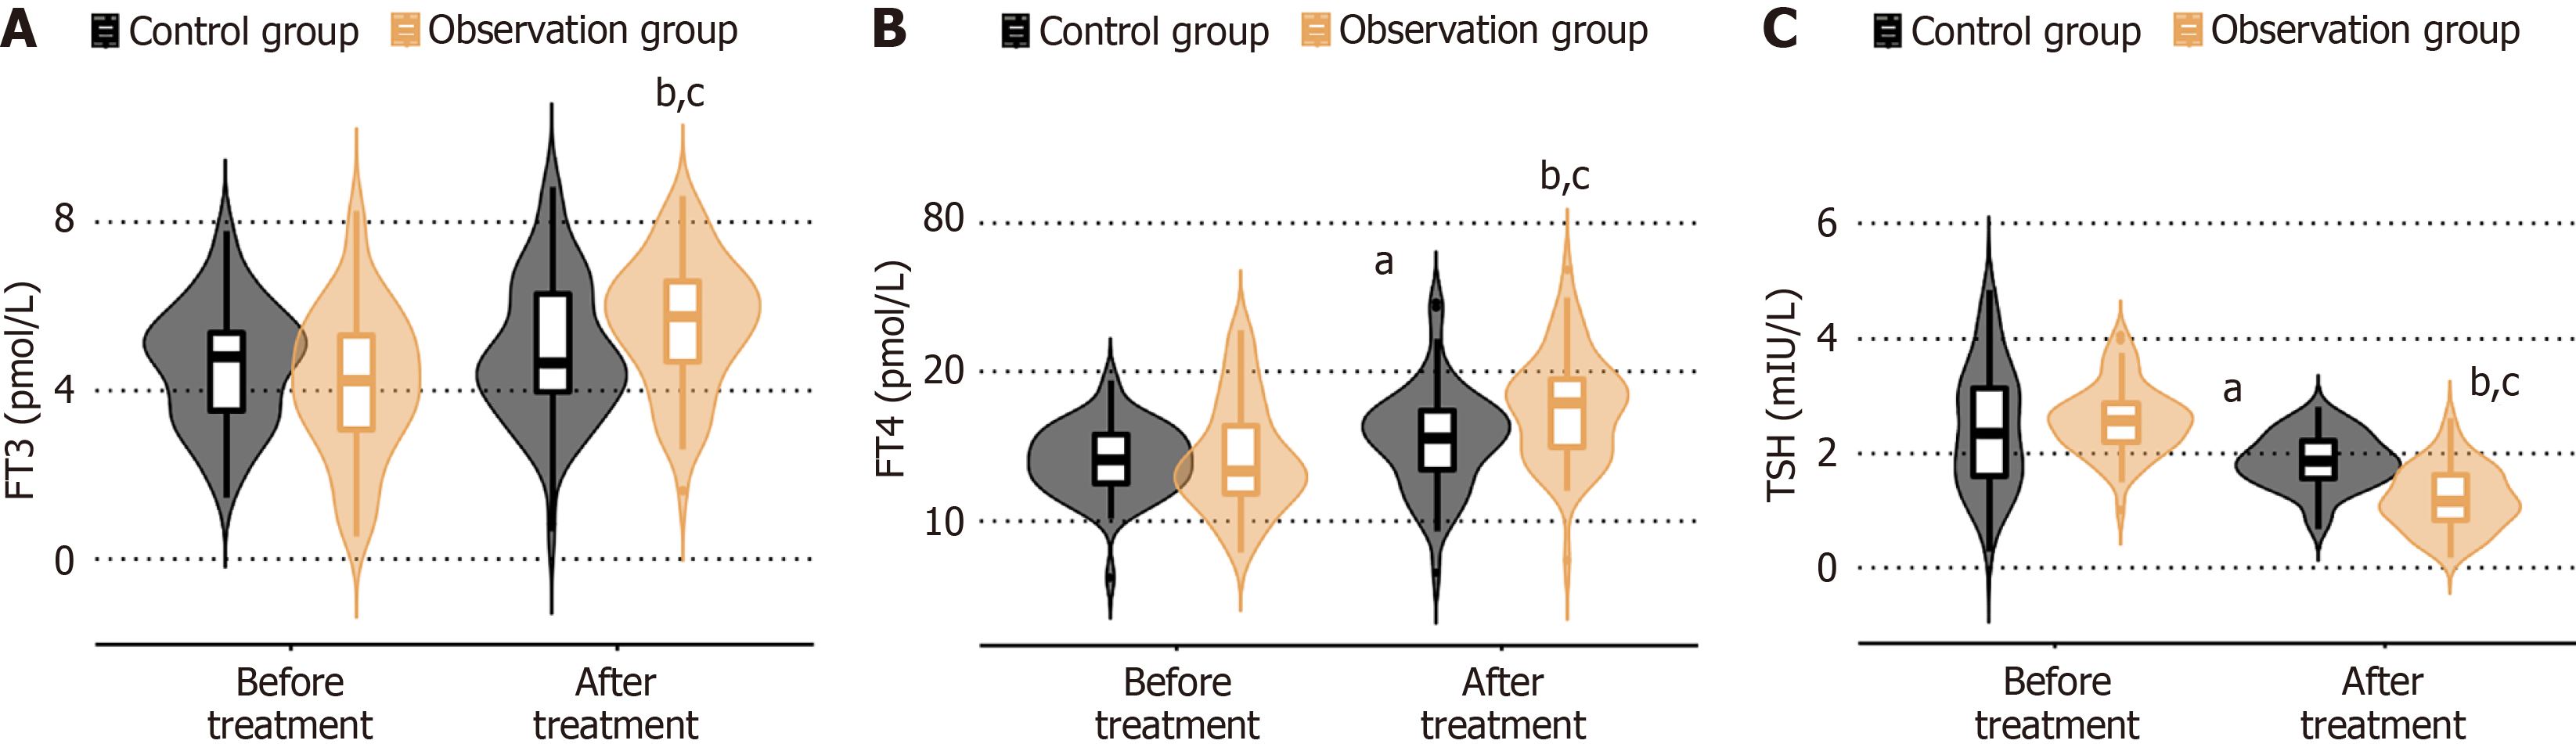
Figure 3 Thyroid function comparisons between control and observation groups.
A: Free triiodothyronine measurements pre-treatment and post-treatment; B: Free thyroxine measurements pre-treatment and post-treatment; C: Thyroid-stimulating hormone measurements pre-treatment and post-treatment. aP < 0.05, bP < 0.01 (significant within-group changes from baseline); cP < 0.05 (between-group differences at matched timepoints). FT3: Free triiodothyronine; FT4: Free thyroxine; TSH: Thyroid-stimulating hormone.
- Citation: Deng J, Zhang C, Xiao YX, Wang L. Jianpi Huazhuo Xiaoying Decoction plus emotional conditioning for thyroid nodule treatment: Impact on treatment outcomes and anxiety/depression. World J Psychiatry 2026; 16(6): 113229
- URL: https://www.wjgnet.com/2220-3206/full/v16/i6/113229.htm
- DOI: https://dx.doi.org/10.5498/wjp.v16.i6.113229