
















Copyright: ©Author(s) 2026.
World J Psychiatry. May 19, 2026; 16(5): 113866
Published online May 19, 2026. doi: 10.5498/wjp.v16.i5.113866
Published online May 19, 2026. doi: 10.5498/wjp.v16.i5.113866
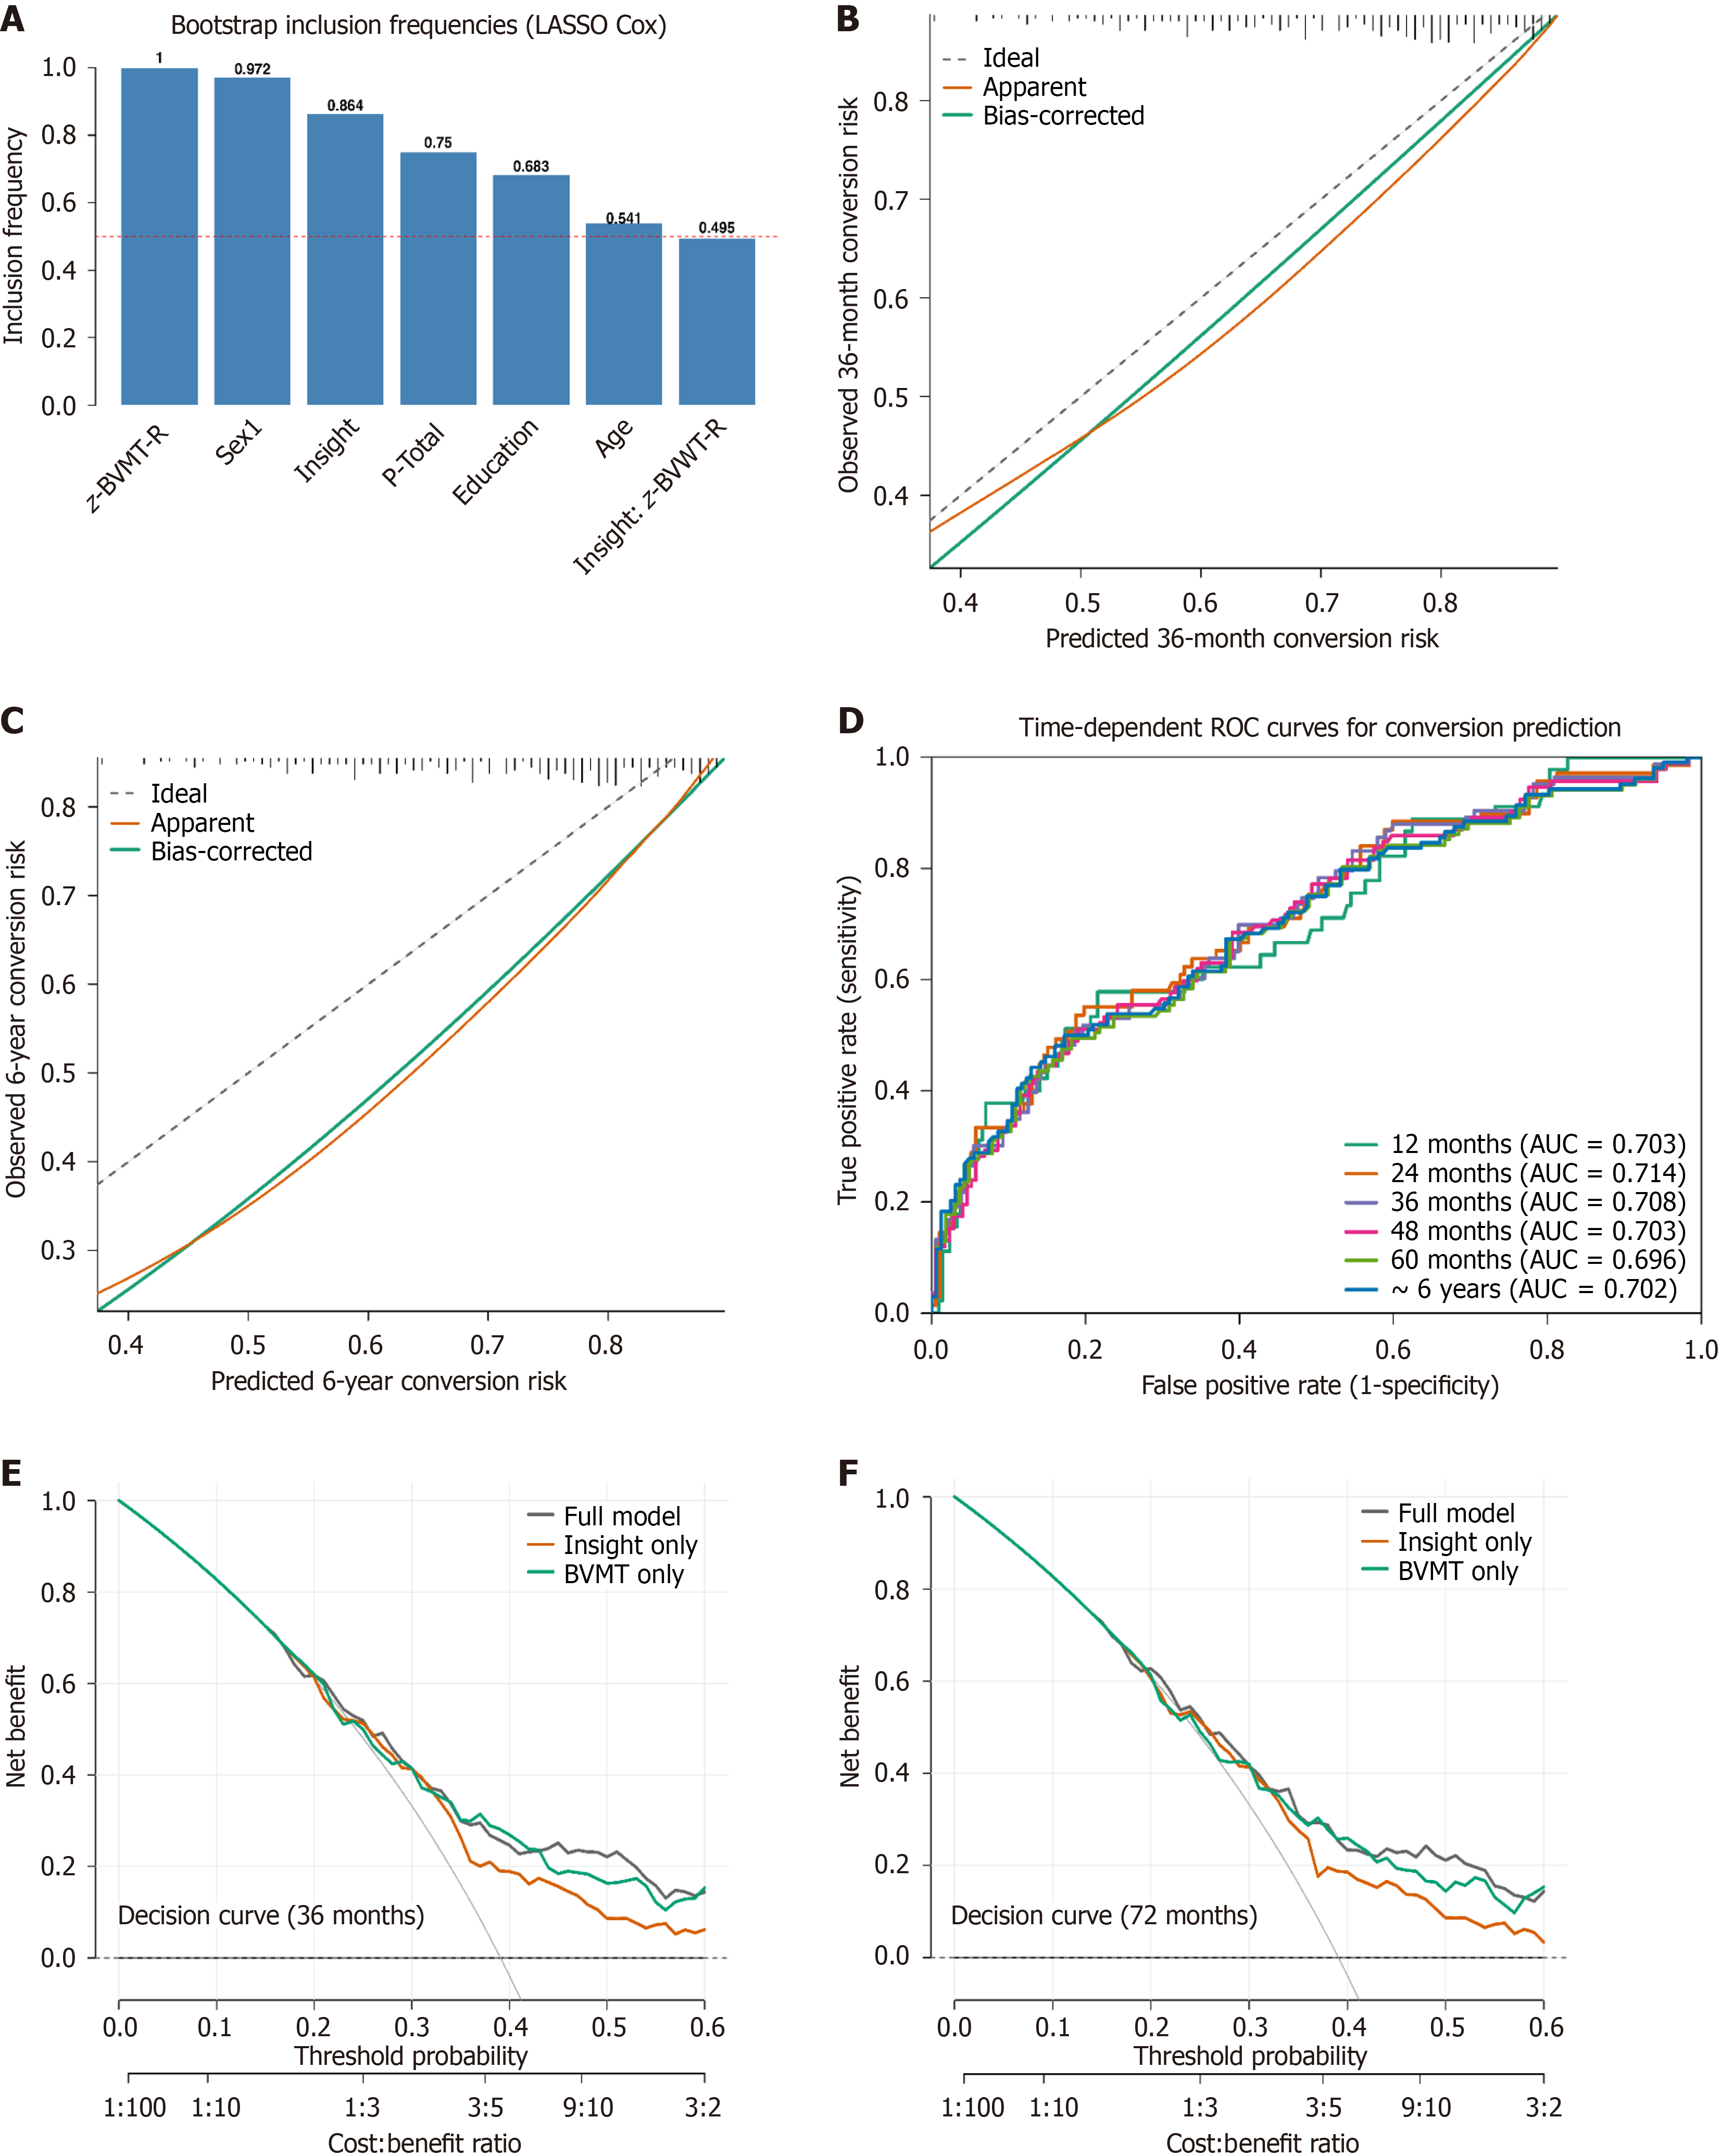
Figure 2 Performance of the Cox conversion prediction model: Variable selection, discrimination, calibration, and clinical utility.
A: Shows bootstrap inclusion frequencies from the least absolute shrinkage and selection operator Cox model; B: Presents time-dependent receiver operating characteristic curves across 12-72 months; C and D: Show calibration plots at 3 years and 6 years, respectively. The grey dashed line represents perfect calibration; the orange line shows the apparent calibration curve; the green line shows the bias-corrected curve from bootstrap resampling; E and F: Display decision curve analyses at 3 years and 6 years, respectively. The dashed horizontal line represents the “treat-none” strategy, and the light gray solid line represents the “treat-all” strategy. LASSO: Least absolute shrinkage and selection operator; z-BVMT-R: Z-score for the Brief Visuospatial Memory Test-Revised; ROC: Receiver operating characteristic; AUC: Area under the curve.
- Citation: Xu LH, Cui HR, Wei YY, Tang XC, Qian ZY, Zhang D, Zheng WS, Zhu TY, Hong XF, Zhu JJ, Hu YG, Liu X, Jiao X, Qing Y, Chen XC, Tang YY, Zhang TH, Wang JJ. Visuospatial memory modulates insight and its predictive value for 6-year psychosis risk in clinical high-risk individuals. World J Psychiatry 2026; 16(5): 113866
- URL: https://www.wjgnet.com/2220-3206/full/v16/i5/113866.htm
- DOI: https://dx.doi.org/10.5498/wjp.v16.i5.113866