















Copyright: ©Author(s) 2026.
World J Psychiatry. Apr 19, 2026; 16(4): 115981
Published online Apr 19, 2026. doi: 10.5498/wjp.v16.i4.115981
Published online Apr 19, 2026. doi: 10.5498/wjp.v16.i4.115981
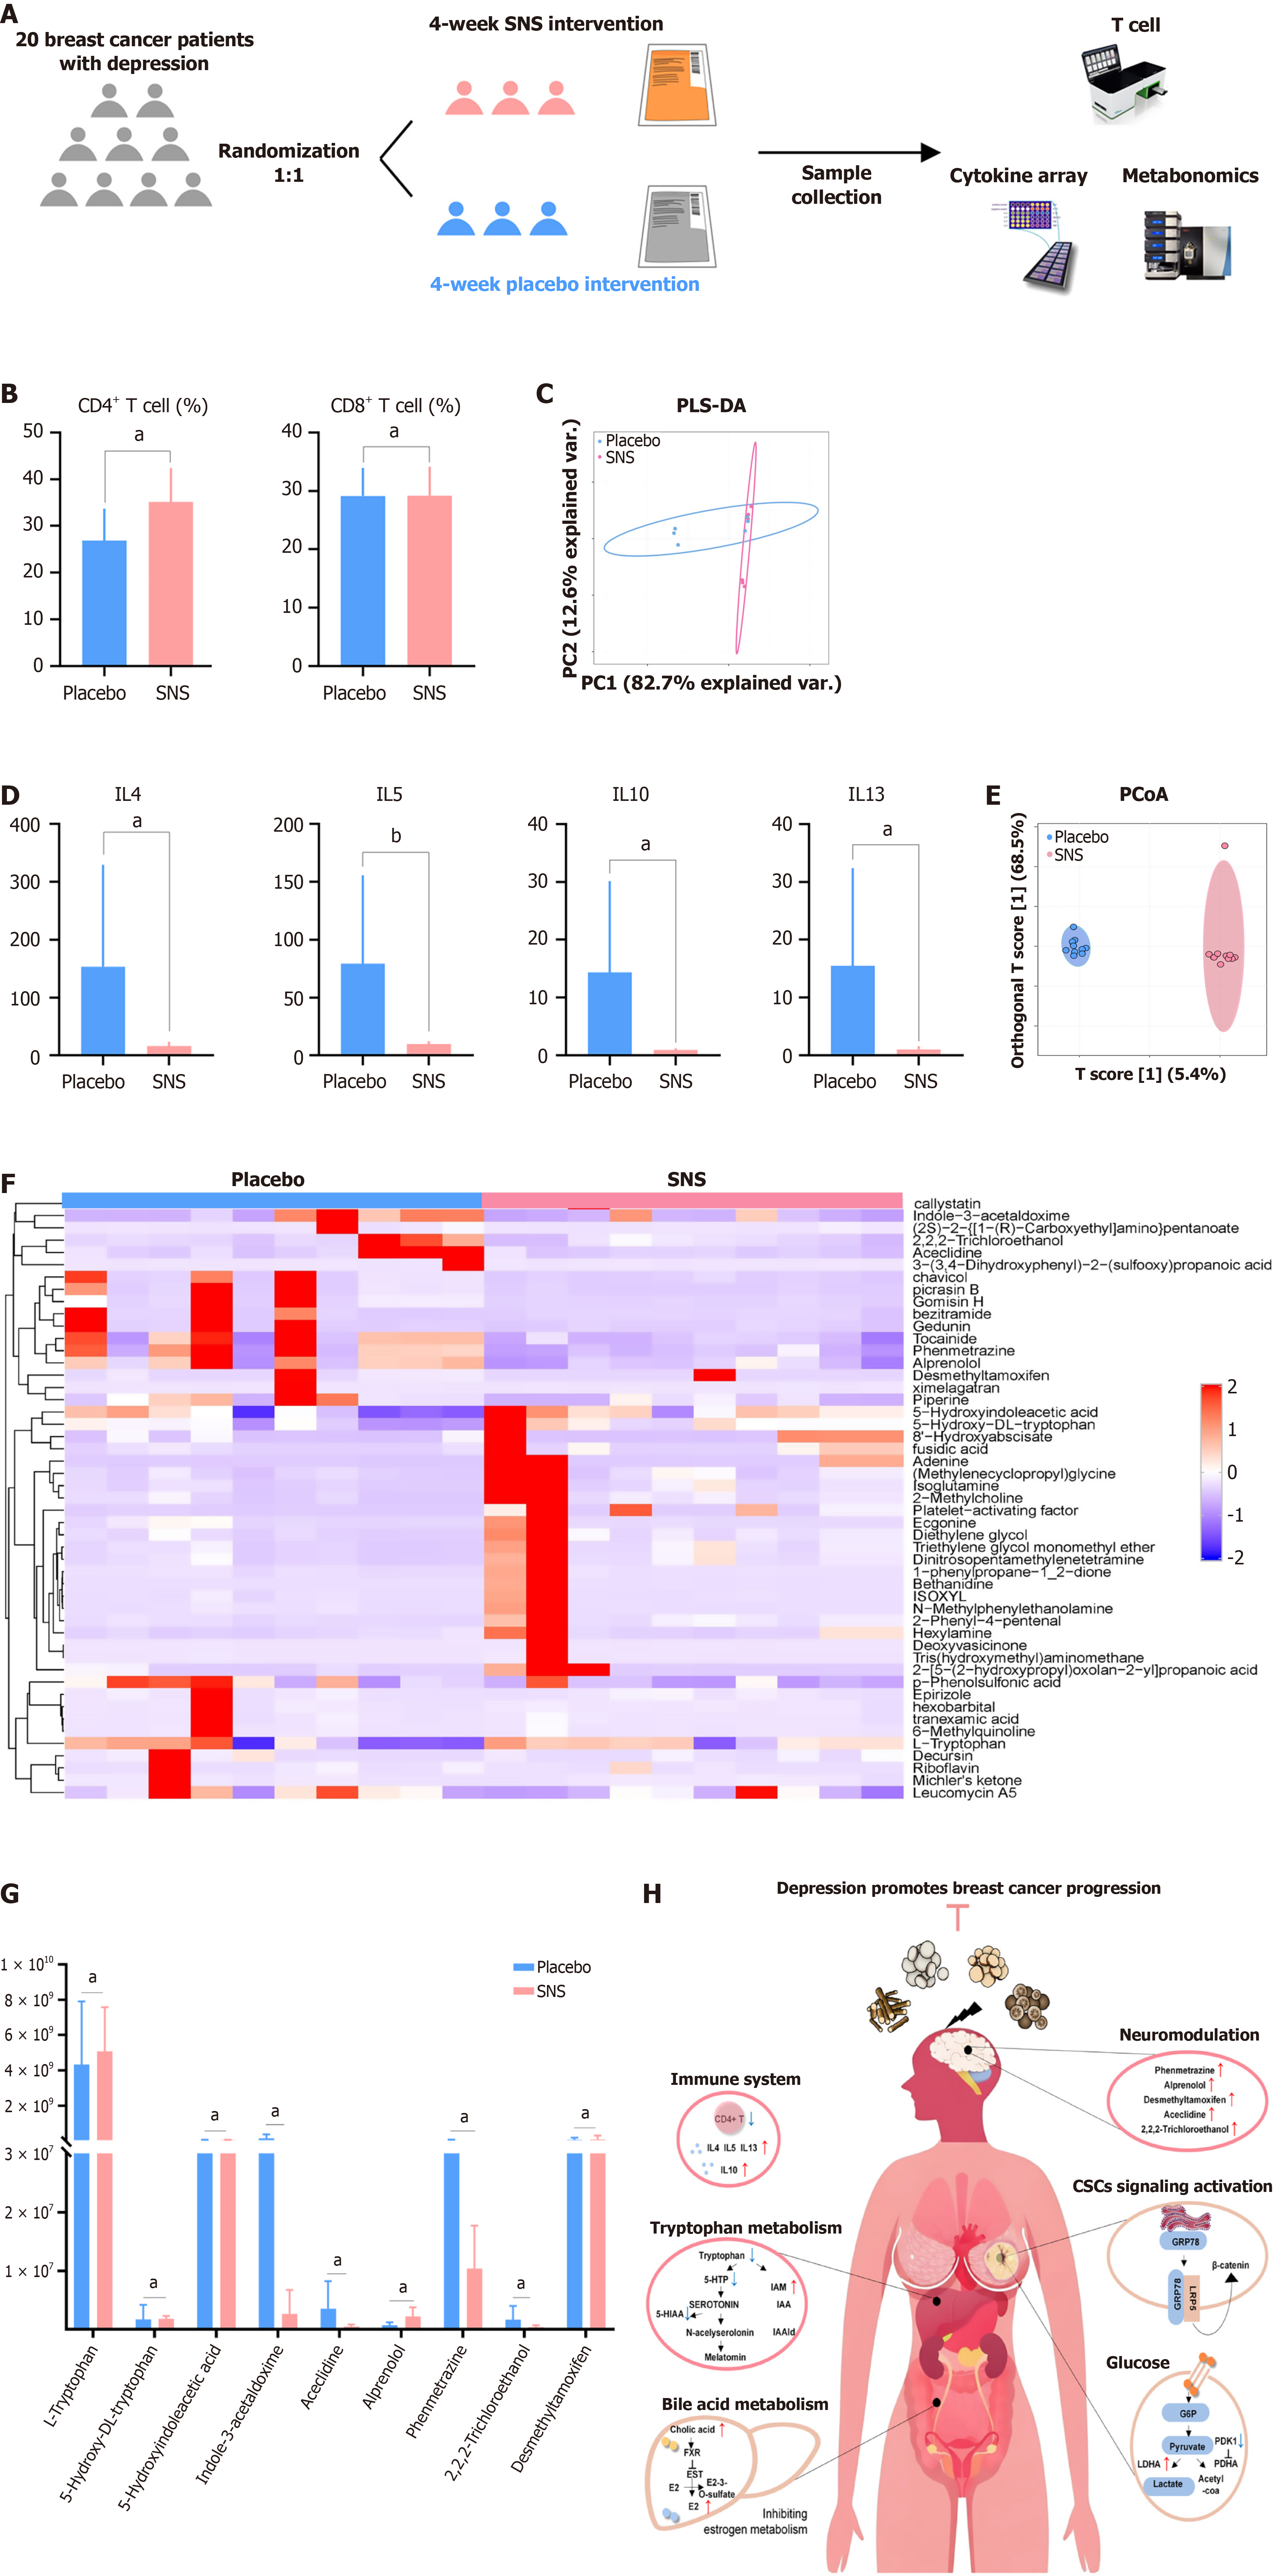
Figure 6 Experimental validation of the antidepressant mechanism of Si-Ni-San.
A: Experimental design schematic comparing the Si-Ni-San treatment group to the placebo control group; B: Alterations in the frequencies of CD4+ and CD8+ T cell populations between groups (n = 10); C: Partial least squares-discriminant analysis of serum cytokine profiles between groups (n = 10 per group); D: Expression levels of key cytokines derived from CD4+ T cells between groups; E: Principal coordinates analysis of serum metabolomic profiles between groups (n = 10 per group); F: Heatmap of serum metabolomic between groups; G: Differential abundance of metabolites between groups; H: Summary of antidepressant mechanisms of Si-Ni-San. SNS: Si-Ni-San; PLS-DA: Partial least squares-discriminant analysis; IL: Interleukin; PCoA: Principal coordinates analysis; CSCs: Cancer stem cells; 5-HTTP: 5-hydroxy-DL-tryptophan; 5-HIAA: 5-hydroxyindoleacetic acid; IAM: Indole-3-acetaldoxime. aP < 0.05, bP < 0.01.
- Citation: Hong SC, Du YY, Wang GB, Wang SQ, Zheng YF, Wang N, Situ HL, Wang ZY. Chinese herbal formulas alleviated depression in breast cancer patients: A meta-analysis, network pharmacology and experimental validation. World J Psychiatry 2026; 16(4): 115981
- URL: https://www.wjgnet.com/2220-3206/full/v16/i4/115981.htm
- DOI: https://dx.doi.org/10.5498/wjp.v16.i4.115981