
















Copyright: ©Author(s) 2026.
World J Psychiatry. Apr 19, 2026; 16(4): 115490
Published online Apr 19, 2026. doi: 10.5498/wjp.v16.i4.115490
Published online Apr 19, 2026. doi: 10.5498/wjp.v16.i4.115490
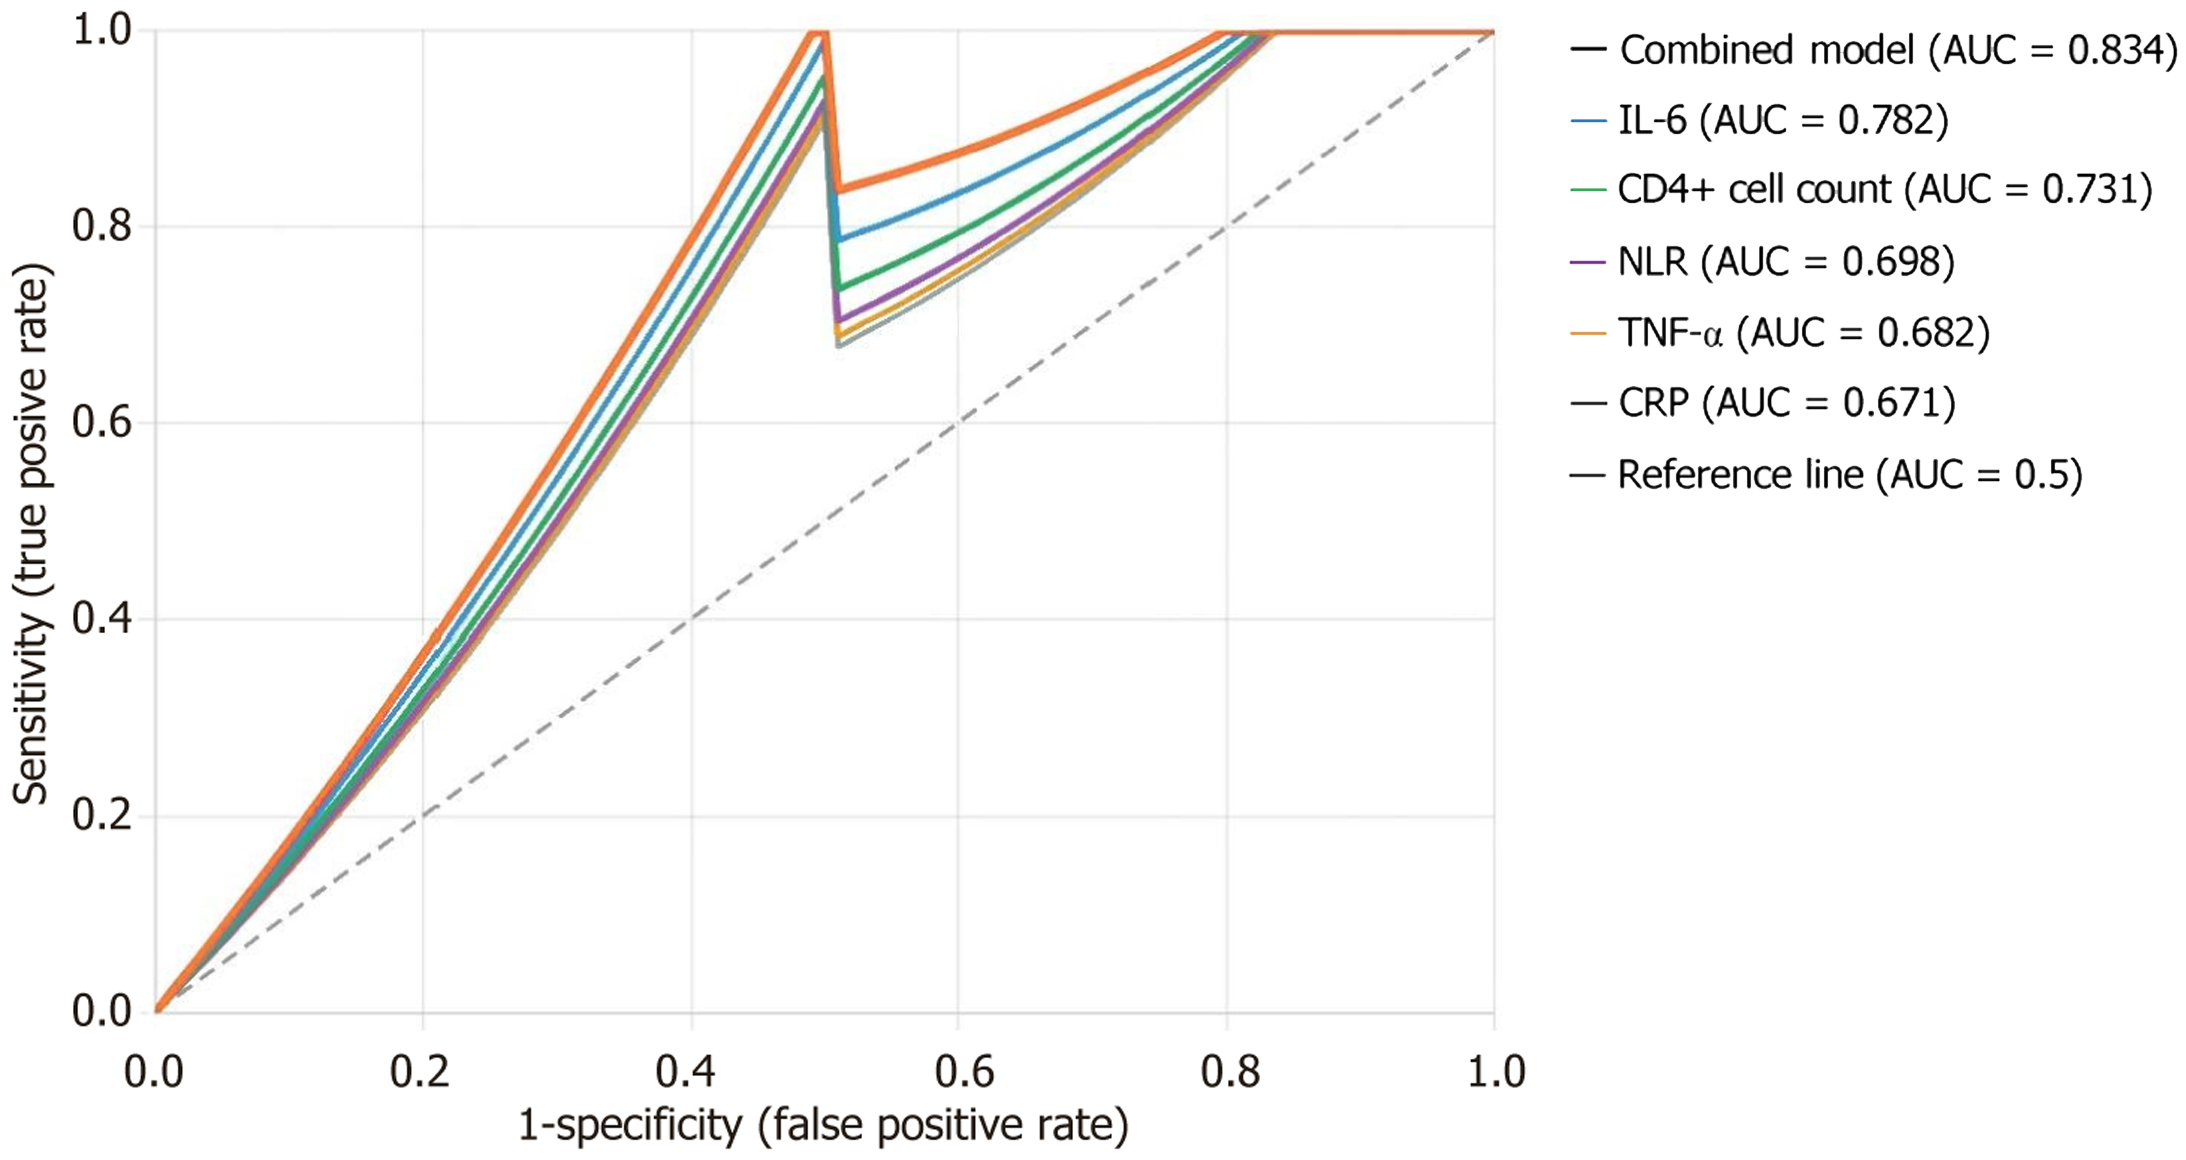
Figure 3 Receiver operating characteristic curve analysis for predicting depression symptoms using immune indicators.
Receiver operating characteristic curves demonstrate the diagnostic performance of various immune markers and predictive models for identifying depression in the study population. The combined model (orange line) incorporating multiple immune parameters shows the highest discriminative ability [area under the curve (AUC) = 0.834], followed by individual immune markers: Interleukin-6 (AUC = 0.782), CD4+ cell count (AUC = 0.731), neutrophil-to-lymphocyte ratio (AUC = 0.688), C-reactive protein (AUC = 0.682), and tumor necrosis factor-α (AUC = 0.671). The reference line (gray dashed diagonal, AUC = 0.5) represents no discriminative ability. All models demonstrate better-than-chance performance, with the combined model showing good overall accuracy for predicting depression symptoms, suggesting that integrating multiple immune biomarkers improves diagnostic utility compared to single markers alone. IL-6: Interleukin-6; NLR: Neutrophil-to-lymphocyte ratio; TNF-α: Tumor necrosis factor-α; CRP: C-reactive protein; AUC: Area under the curve.
- Citation: Dong S, Mou HL, Zhang H, Ye T. Correlation analysis of depressive symptoms and immune function indicators in patients with malignant melanoma. World J Psychiatry 2026; 16(4): 115490
- URL: https://www.wjgnet.com/2220-3206/full/v16/i4/115490.htm
- DOI: https://dx.doi.org/10.5498/wjp.v16.i4.115490