
















Copyright: ©Author(s) 2026.
World J Psychiatry. Apr 19, 2026; 16(4): 115490
Published online Apr 19, 2026. doi: 10.5498/wjp.v16.i4.115490
Published online Apr 19, 2026. doi: 10.5498/wjp.v16.i4.115490
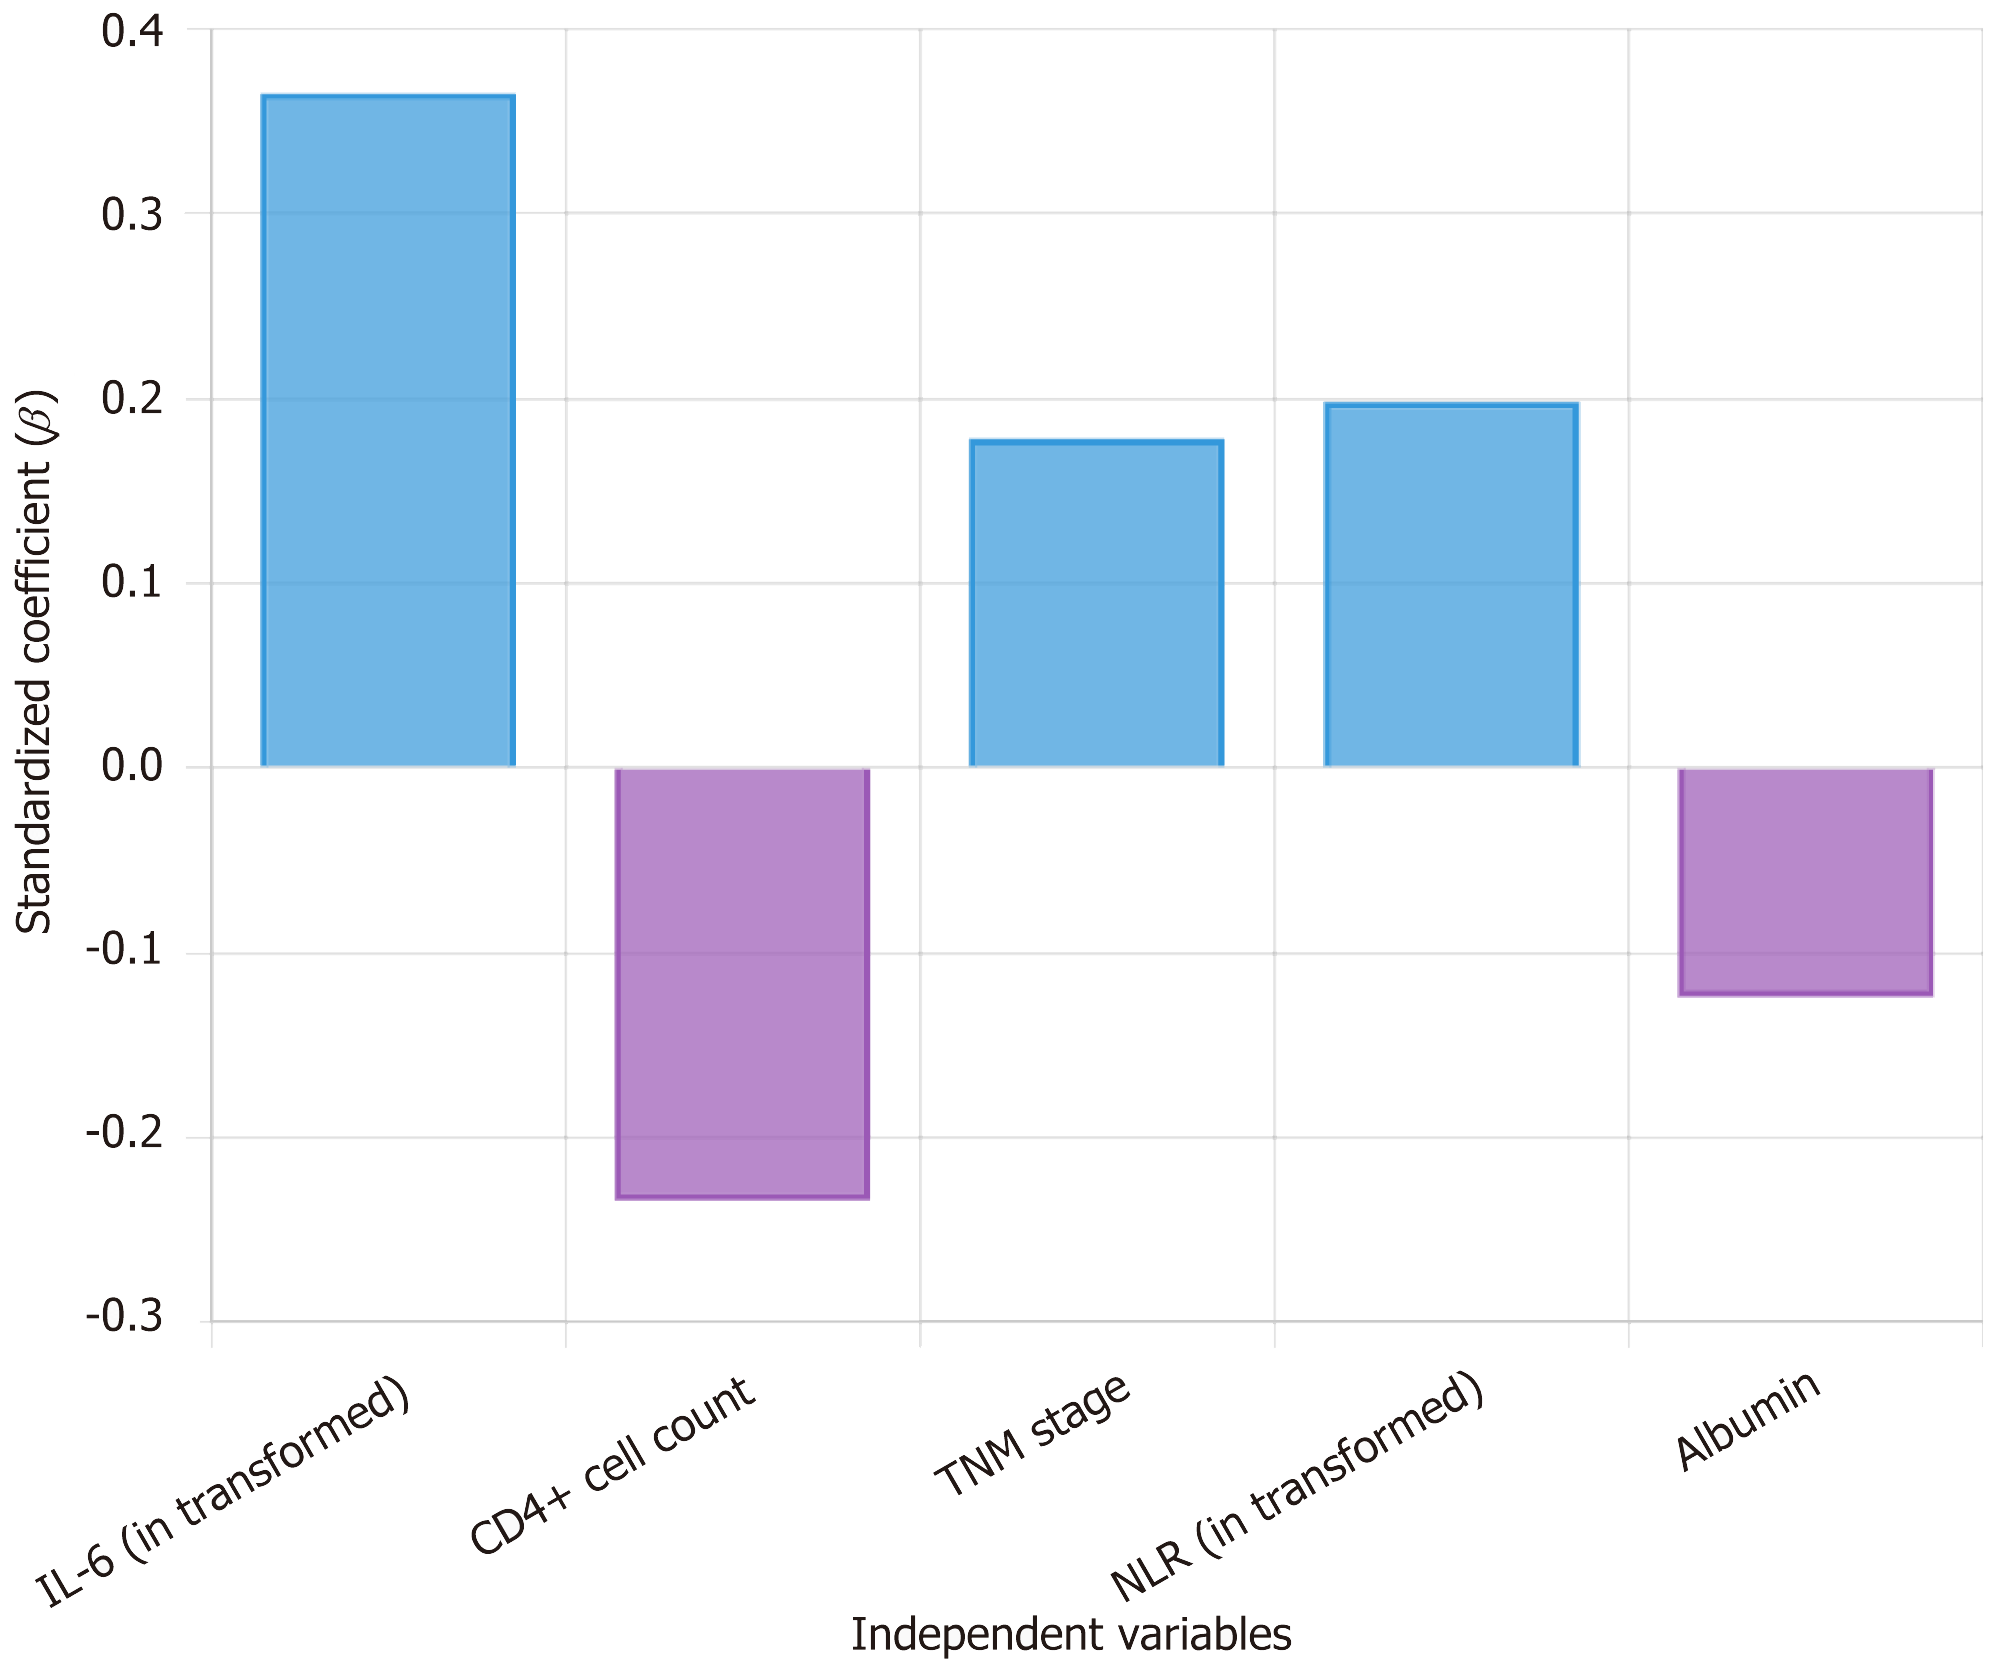
Figure 2 Multiple linear regression analysis of independent predictors for depression symptoms.
The bar chart presents standardized regression coefficients (β) from multivariable analysis identifying significant independent predictors of Patient Health Questionnaire-9 depression scores. Blue bars represent positive predictors: Interleukin-6 (ln transformed) shows the strongest positive association (β approximately 0.36), followed by tumor-node-metastasis stage (β approximately 0.18) and neutrophil-to-lymphocyte ratio (ln transformed) (β approximately 0.20), indicating that higher values of these variables are associated with increased depression severity. Purple bars indicate negative predictors: CD4+ cell count (β approximately -0.24) and albumin (β approximately -0.12) show inverse associations, suggesting that lower levels of these markers are linked to greater depressive symptoms. All displayed variables represent statistically significant independent predictors after controlling for potential confounders in the regression model. IL-6: Interleukin-6; TNM: Tumor-node-metastasis; NLR: Neutrophil-to-lymphocyte ratio.
- Citation: Dong S, Mou HL, Zhang H, Ye T. Correlation analysis of depressive symptoms and immune function indicators in patients with malignant melanoma. World J Psychiatry 2026; 16(4): 115490
- URL: https://www.wjgnet.com/2220-3206/full/v16/i4/115490.htm
- DOI: https://dx.doi.org/10.5498/wjp.v16.i4.115490