















Copyright: ©Author(s) 2026.
World J Psychiatry. Apr 19, 2026; 16(4): 115490
Published online Apr 19, 2026. doi: 10.5498/wjp.v16.i4.115490
Published online Apr 19, 2026. doi: 10.5498/wjp.v16.i4.115490
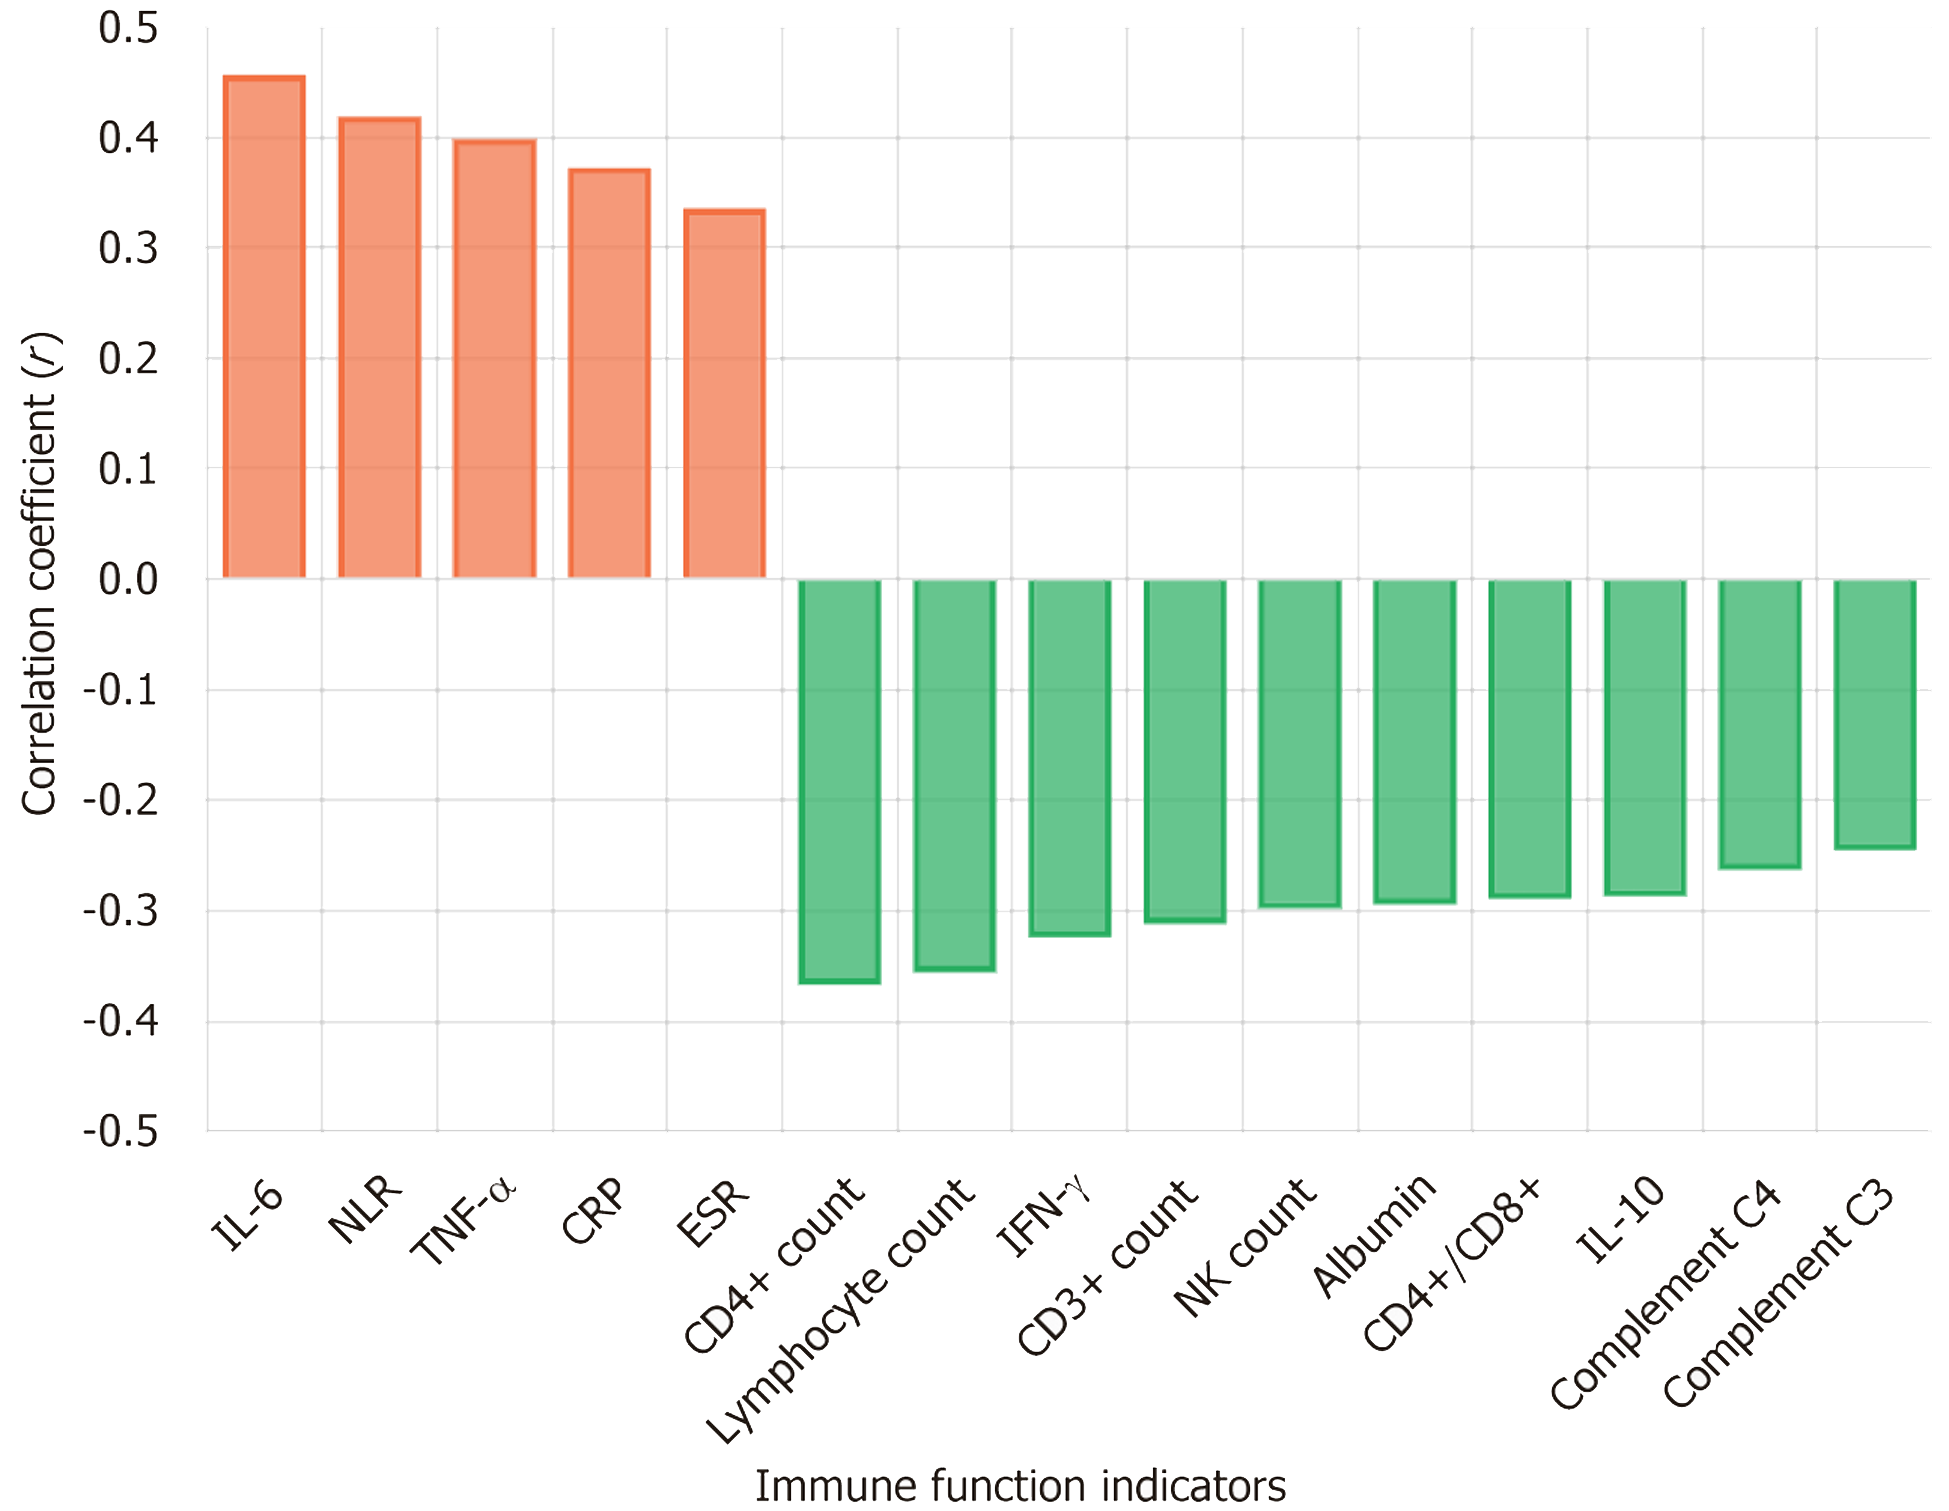
Figure 1 Correlation between Patient Health Questionnaire-9 scores and immune function indicators.
The bar chart displays Pearson correlation coefficients (r) between Patient Health Questionnaire-9 depression scores and various immune function markers. Orange bars indicate positive correlations, showing immune indicators that increase with higher depression scores (interleukin-6, neutrophil-to-lymphocyte ratio, tumor necrosis factor-α, C-reactive protein, and erythrocyte sedimentation rate). Green bars represent negative correlations, indicating immune markers that decrease as depression severity increases (CD3+CD4+, lymphocyte count, interferon-γ, natural killer cell count, CD3+CD8+, CD3+CD56+, interleukin-10, and complement components C4 and C3). Correlation coefficients range from approximately +0.45 to -0.30, suggesting moderate associations between depressive symptoms and immune dysregulation. IL-6: Interleukin-6; NLR: Neutrophil-to-lymphocyte ratio; TNF-α: Tumor necrosis factor-α; CRP: C-reactive protein; ESR: Erythrocyte sedimentation rate; IFN-γ: Interferon-γ; NK: Natural killer; IL-10: Interleukin-10.
- Citation: Dong S, Mou HL, Zhang H, Ye T. Correlation analysis of depressive symptoms and immune function indicators in patients with malignant melanoma. World J Psychiatry 2026; 16(4): 115490
- URL: https://www.wjgnet.com/2220-3206/full/v16/i4/115490.htm
- DOI: https://dx.doi.org/10.5498/wjp.v16.i4.115490