















Copyright: ©Author(s) 2026.
World J Psychiatry. Apr 19, 2026; 16(4): 112755
Published online Apr 19, 2026. doi: 10.5498/wjp.v16.i4.112755
Published online Apr 19, 2026. doi: 10.5498/wjp.v16.i4.112755
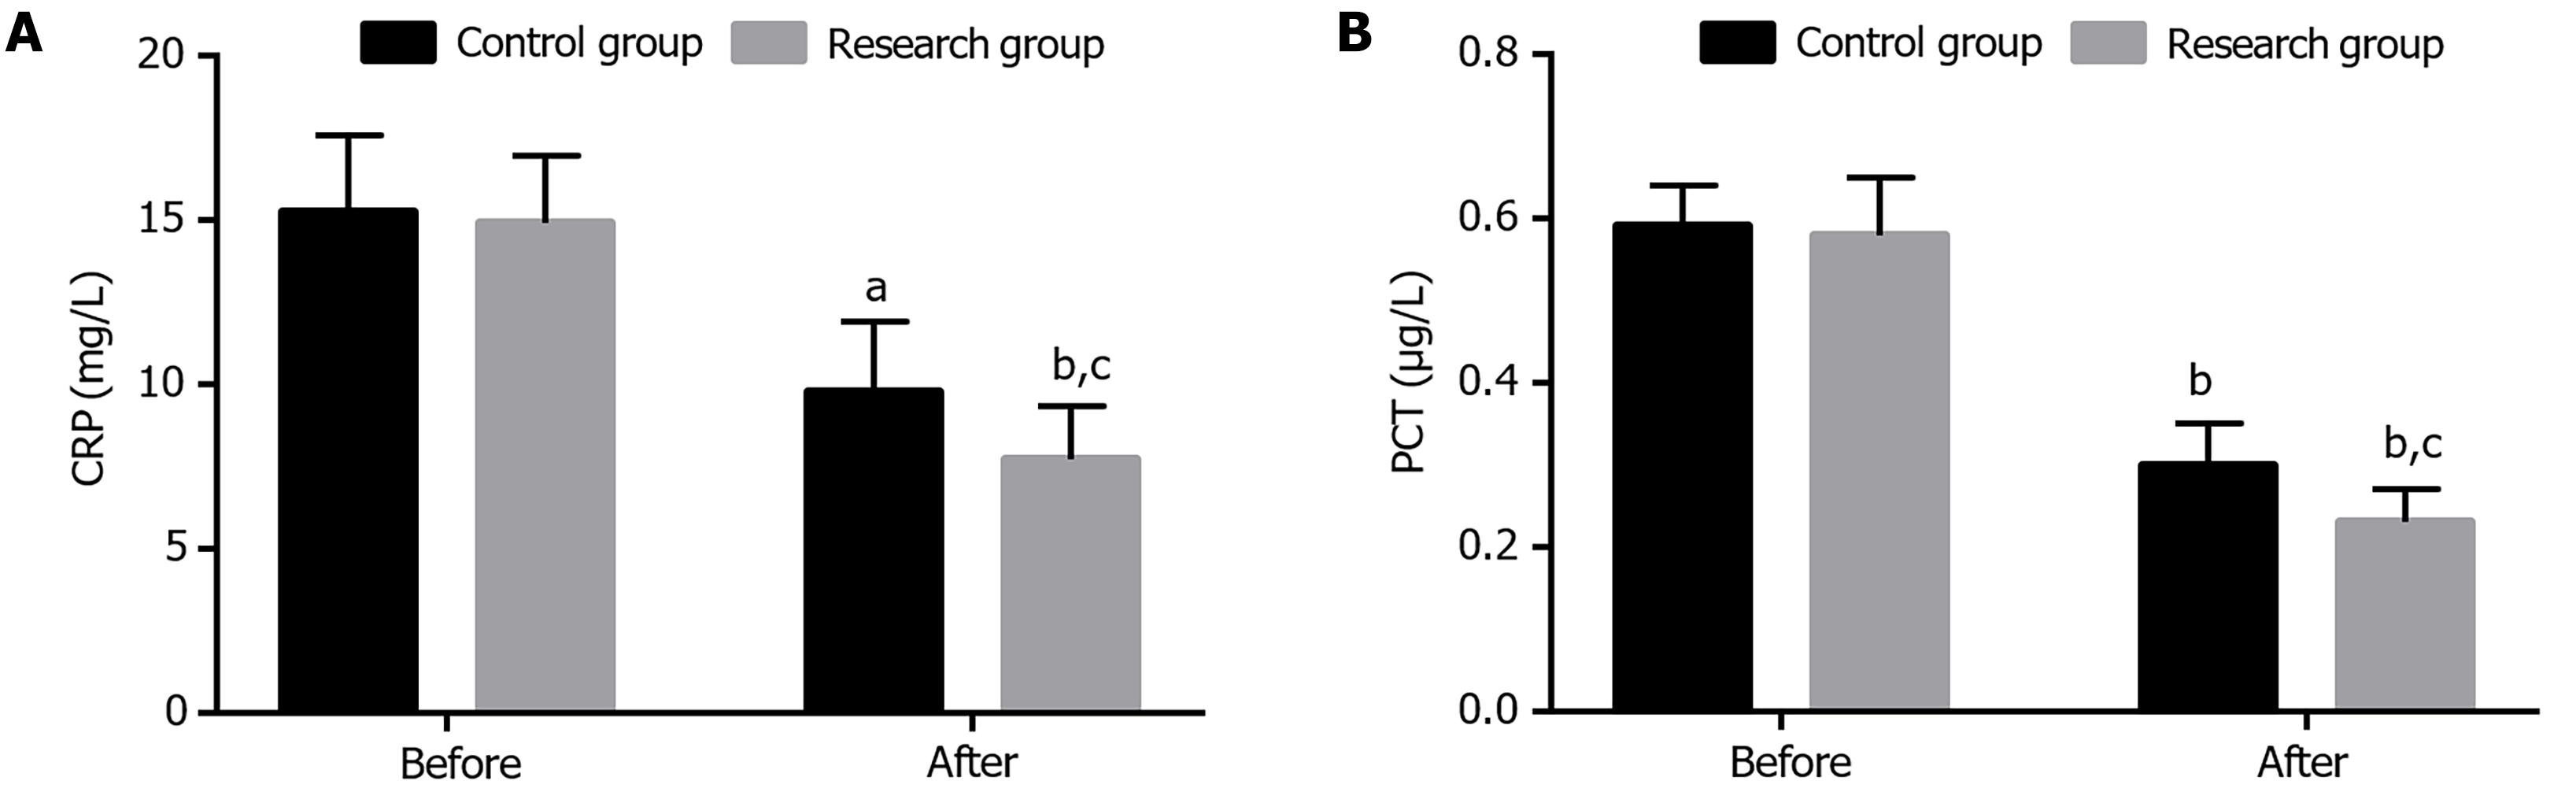
Figure 3 Serum biochemical indexes of the two groups.
A: The research group showed lower C-reactive protein levels than the control group after treatment; B: The research group showed lower procalcitonin levels than the control group after treatment. aP < 0.05 vs before treatment; bP < 0.01 vs before treatment; cP < 0.05 vs control group. CRP: C-reactive protein; PCT: Procalcitonin.
- Citation: Shen FF, Lin DX, Li H. Effect of paroxetine on neurological function and psychological state in patients with depression after acute ischemic stroke. World J Psychiatry 2026; 16(4): 112755
- URL: https://www.wjgnet.com/2220-3206/full/v16/i4/112755.htm
- DOI: https://dx.doi.org/10.5498/wjp.v16.i4.112755