
















©Author(s) (or their employer(s)) 2026.
World J Psychiatry. Mar 19, 2026; 16(3): 114446
Published online Mar 19, 2026. doi: 10.5498/wjp.v16.i3.114446
Published online Mar 19, 2026. doi: 10.5498/wjp.v16.i3.114446
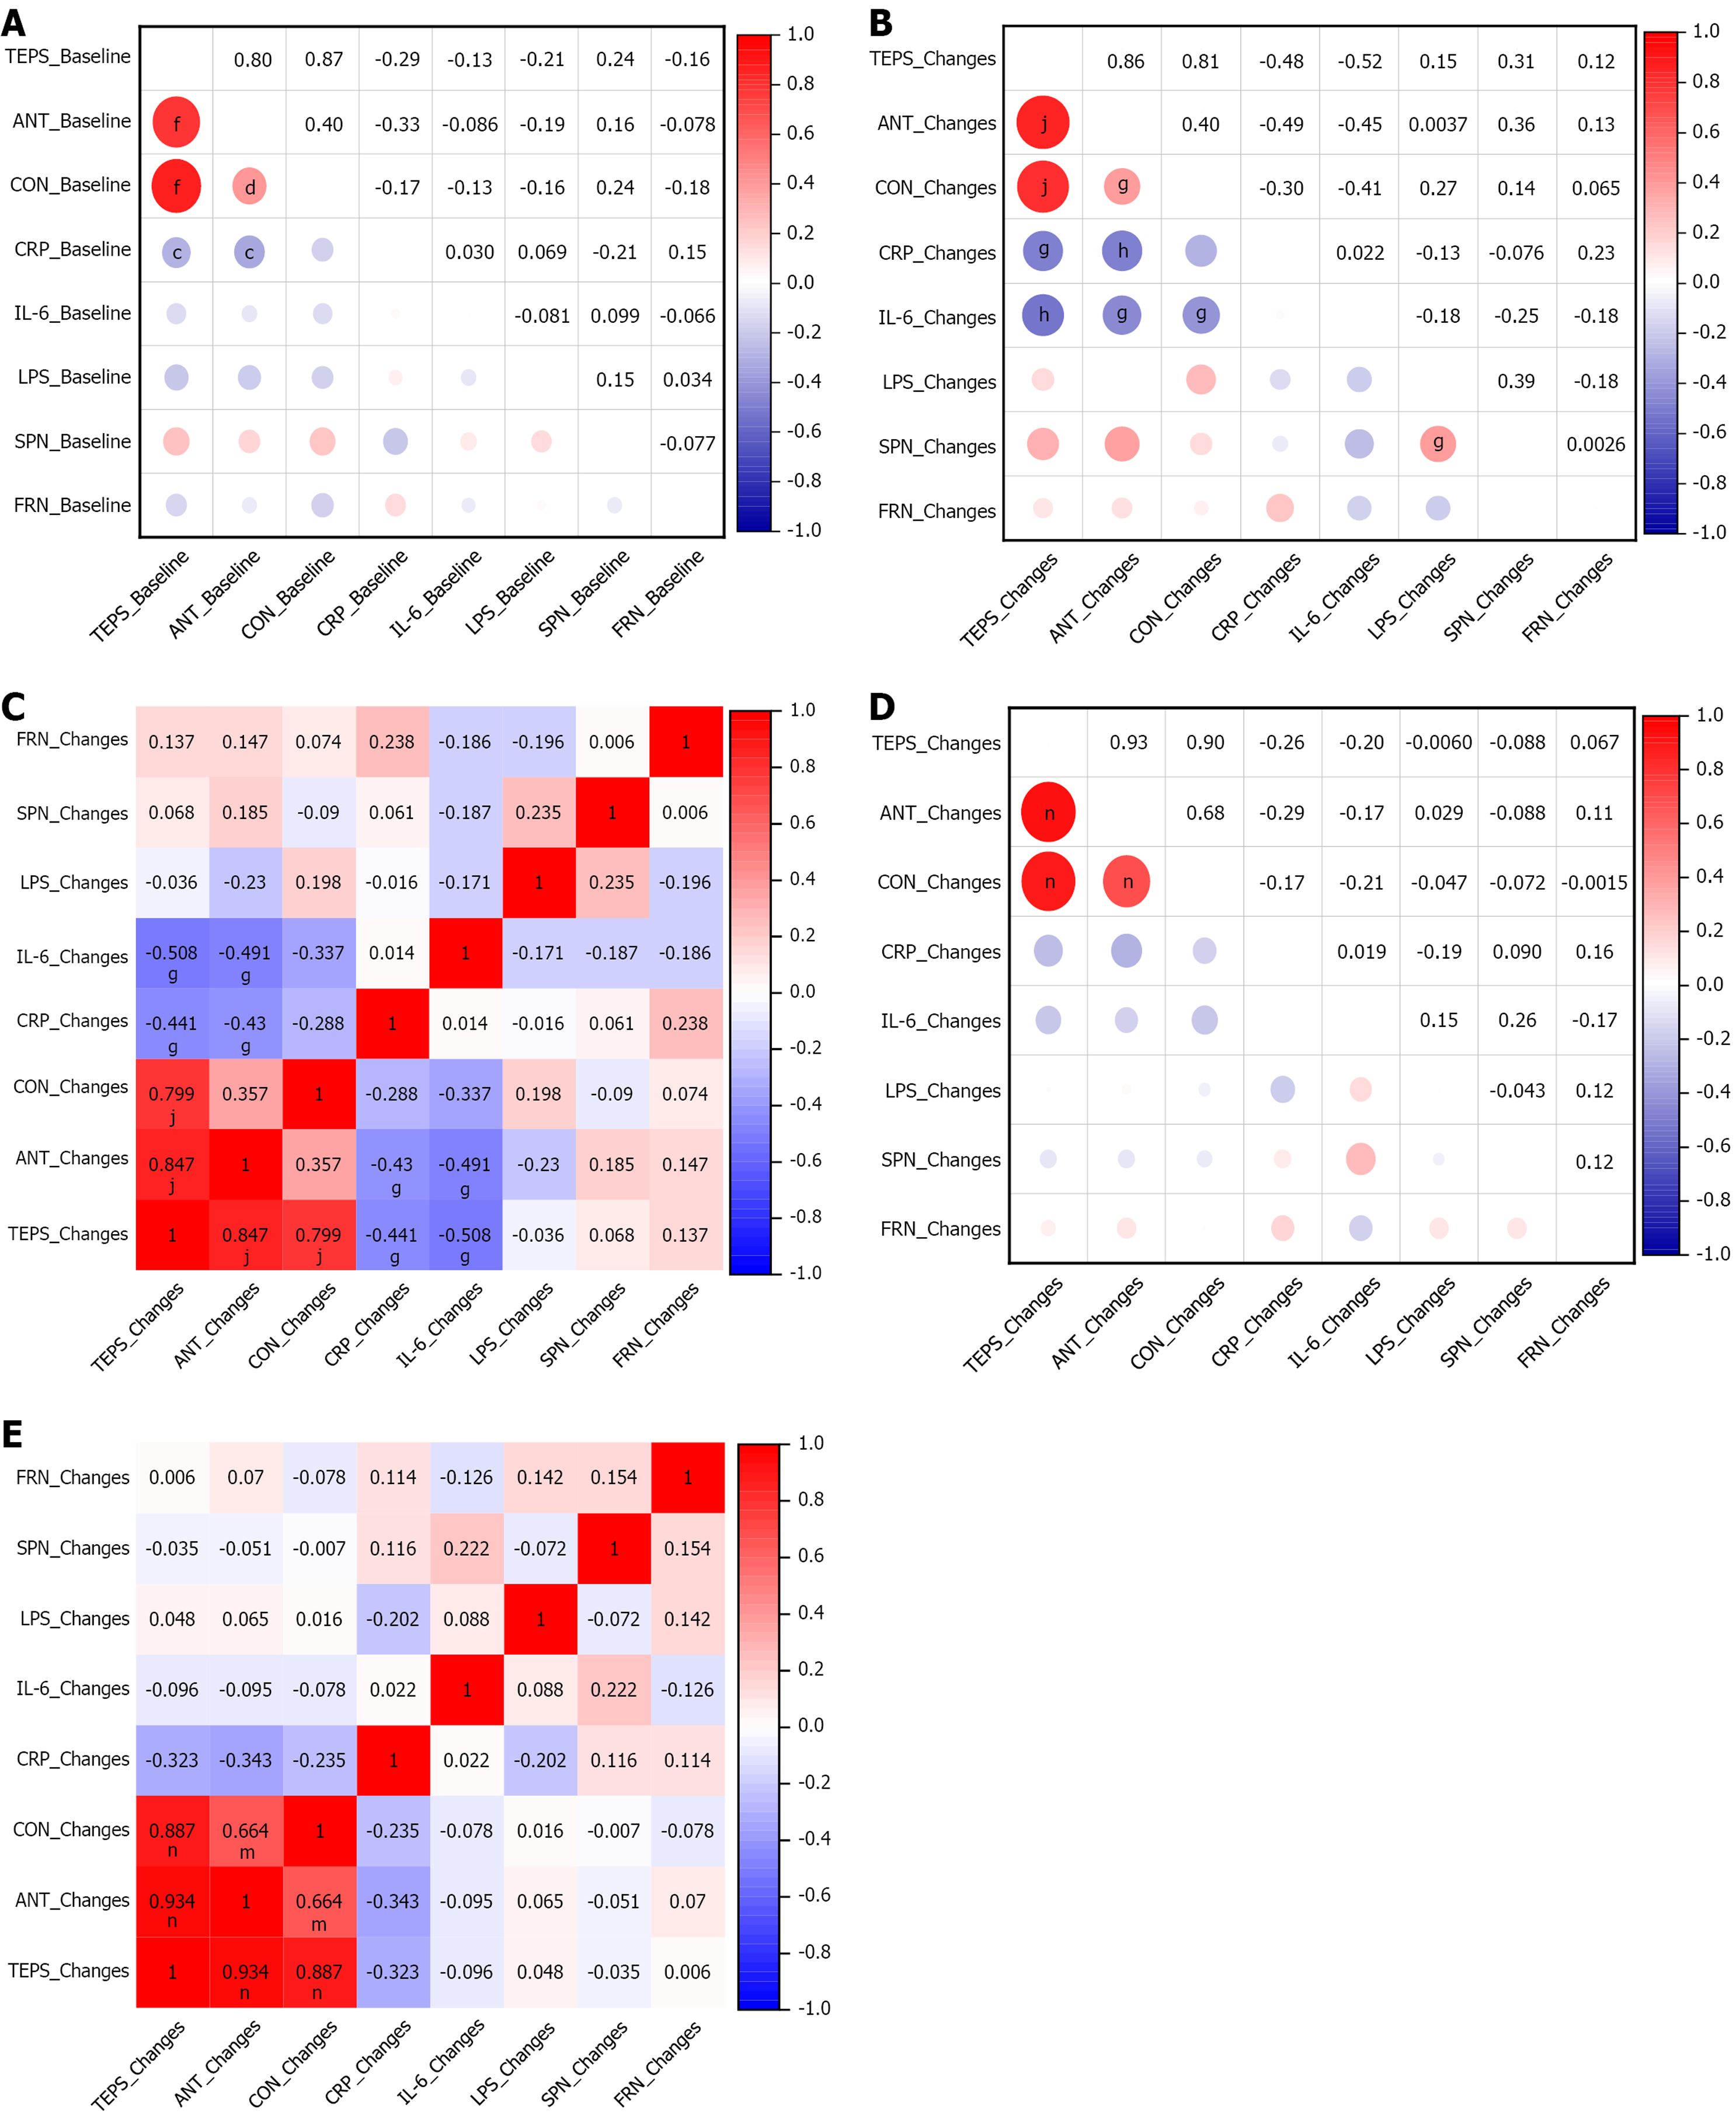
Figure 2 Correlation analyses of baseline and change values.
This figure summarizes the Pearson and partial correlation analyses conducted on baseline variables and change values in both the CCFM6432 and placebo groups. Change value = baseline value - follow-up value. A: Pearson correlation analysis of baseline variables in the two groups. cP < 0.05; dP < 0.01; eP < 0.001; fP < 0.0001; B: Pearson correlation analysis of change values in the CCFM6432 group. gP < 0.05; hP < 0.01; iP < 0.001; jP < 0.0001; C: Partial correlation analysis of change values in the CCFM6432 group controlling for changes in Hamilton Anxiety Rating Scale and Hamilton Depression Rating Scale. gP < 0.05; hP < 0.01; iP < 0.001; jP < 0.0001; D: Pearson correlation analysis of change values in the placebo group. kP < 0.05; lP < 0.01; mP < 0.001; nP < 0.0001; E: Partial correlation analysis of change values in the placebo group controlling for changes in Hamilton Anxiety Rating Scale and Hamilton Depression Rating Scale. kP < 0.05; lP < 0.01; mP < 0.001; nP < 0.0001. TEPS: Temporal Experience of Pleasure Scale; ANT: Anticipatory; CON: Consummatory; CRP: C-reactive protein; IL-6: Interleukin-6; LPS: Lipopolysaccharide; SPN: Stimulus-preceding negativity; FRN: Feedback-related negativity.
- Citation: Li DX, Gu Y, Xia WJ, Sun YF, Hou L, Zhu WX, Wang J. Pediococcus acidilactici CCFM6432 alleviates anhedonia in major depression through immune-inflammatory modulation: An extended trial analysis. World J Psychiatry 2026; 16(3): 114446
- URL: https://www.wjgnet.com/2220-3206/full/v16/i3/114446.htm
- DOI: https://dx.doi.org/10.5498/wjp.v16.i3.114446