
















©Author(s) (or their employer(s)) 2026.
World J Psychiatry. Mar 19, 2026; 16(3): 114036
Published online Mar 19, 2026. doi: 10.5498/wjp.v16.i3.114036
Published online Mar 19, 2026. doi: 10.5498/wjp.v16.i3.114036
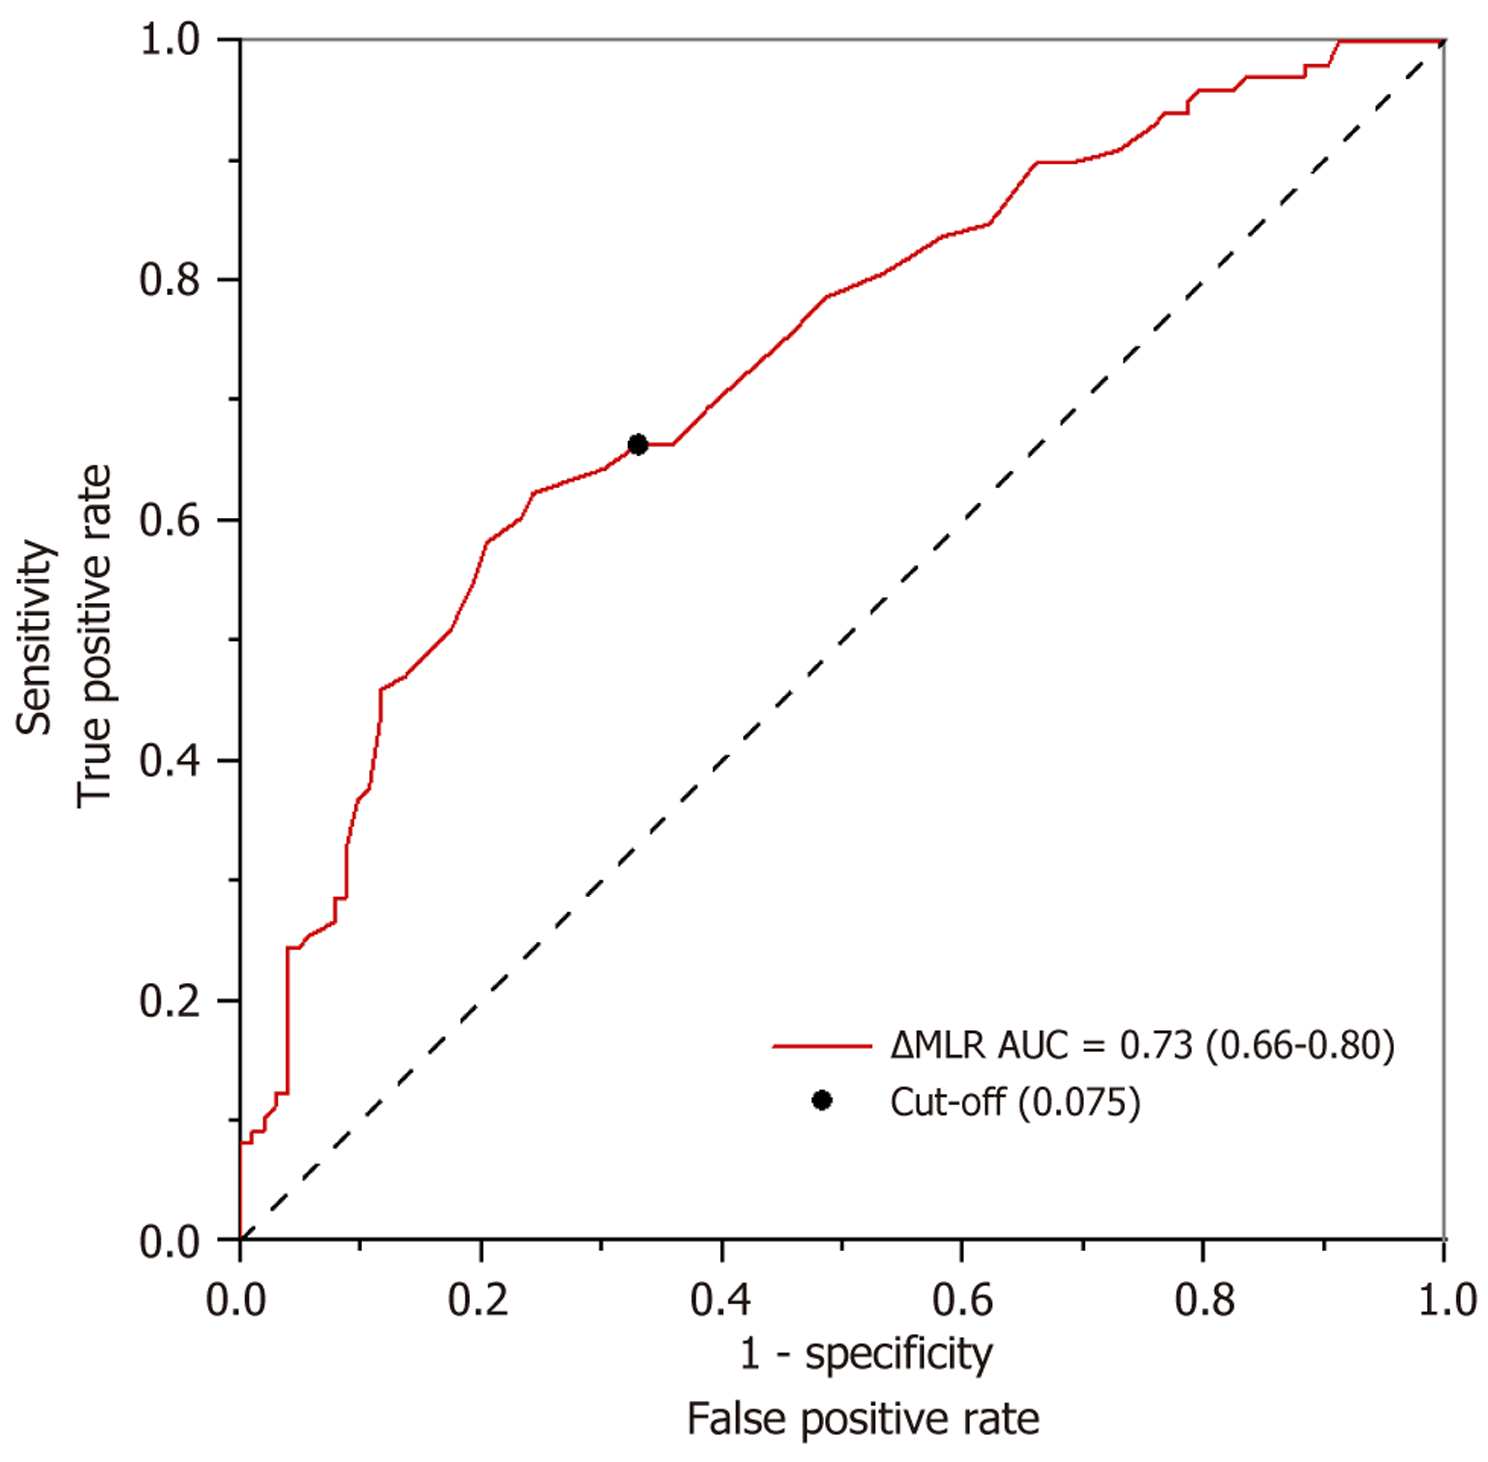
Figure 3 Receiver operating characteristic curve for Δmonocyte-to-lymphocyte ratio in predicting treatment outcomes of modified ele
- Citation: Hou L, Chen R, Huang CB, Shi WJ, Wu LL. Clinical symptom improvement following modified electroconvulsive therapy is associated with modulation of peripheral inflammatory markers in schizophrenia. World J Psychiatry 2026; 16(3): 114036
- URL: https://www.wjgnet.com/2220-3206/full/v16/i3/114036.htm
- DOI: https://dx.doi.org/10.5498/wjp.v16.i3.114036