
















©Author(s) (or their employer(s)) 2026.
World J Psychiatry. Mar 19, 2026; 16(3): 112649
Published online Mar 19, 2026. doi: 10.5498/wjp.v16.i3.112649
Published online Mar 19, 2026. doi: 10.5498/wjp.v16.i3.112649
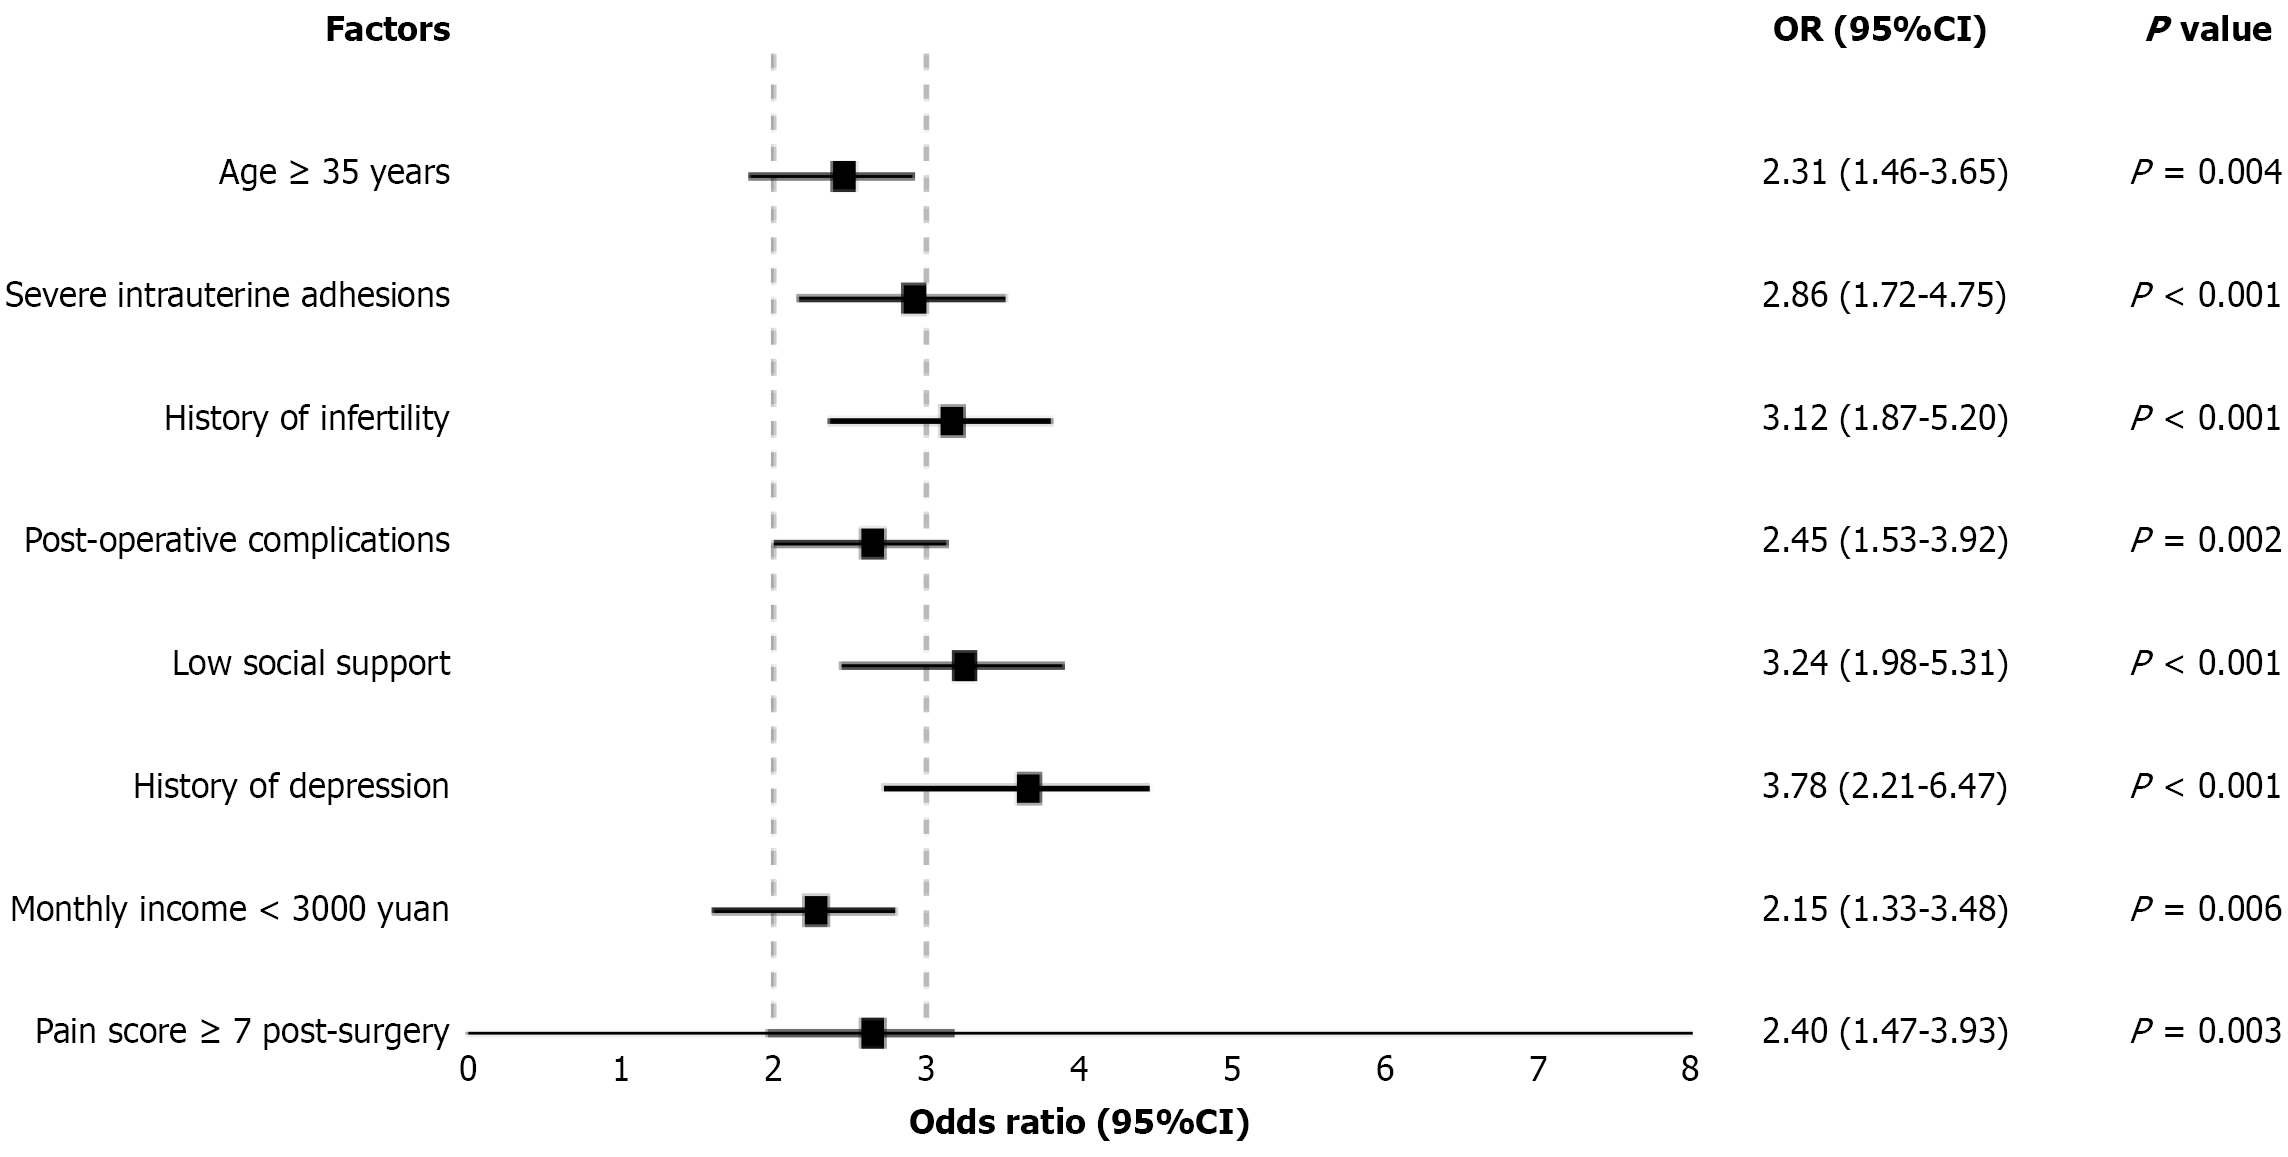
Figure 3 Forest plot of risk factors for post-operative depression.
The odds ratios indicate the strength of association between each factor and post-operative depression, with values greater than 1 suggesting increased risk. The P values (all < 0.05) indicate that these associations are statistically significant. This analysis helps clinicians identify high-risk patients who might benefit from preventive interventions or closer monitoring for depression following surgery. OR: Odds ratio; CI: Confidence interval.
- Citation: Du WL, Chen S, Zhan SS. Analysis of risk factors for postoperative depressive disorders in patients with intrauterine adhesions. World J Psychiatry 2026; 16(3): 112649
- URL: https://www.wjgnet.com/2220-3206/full/v16/i3/112649.htm
- DOI: https://dx.doi.org/10.5498/wjp.v16.i3.112649