
















©The Author(s) 2026.
World J Psychiatry. Feb 19, 2026; 16(2): 113513
Published online Feb 19, 2026. doi: 10.5498/wjp.v16.i2.113513
Published online Feb 19, 2026. doi: 10.5498/wjp.v16.i2.113513
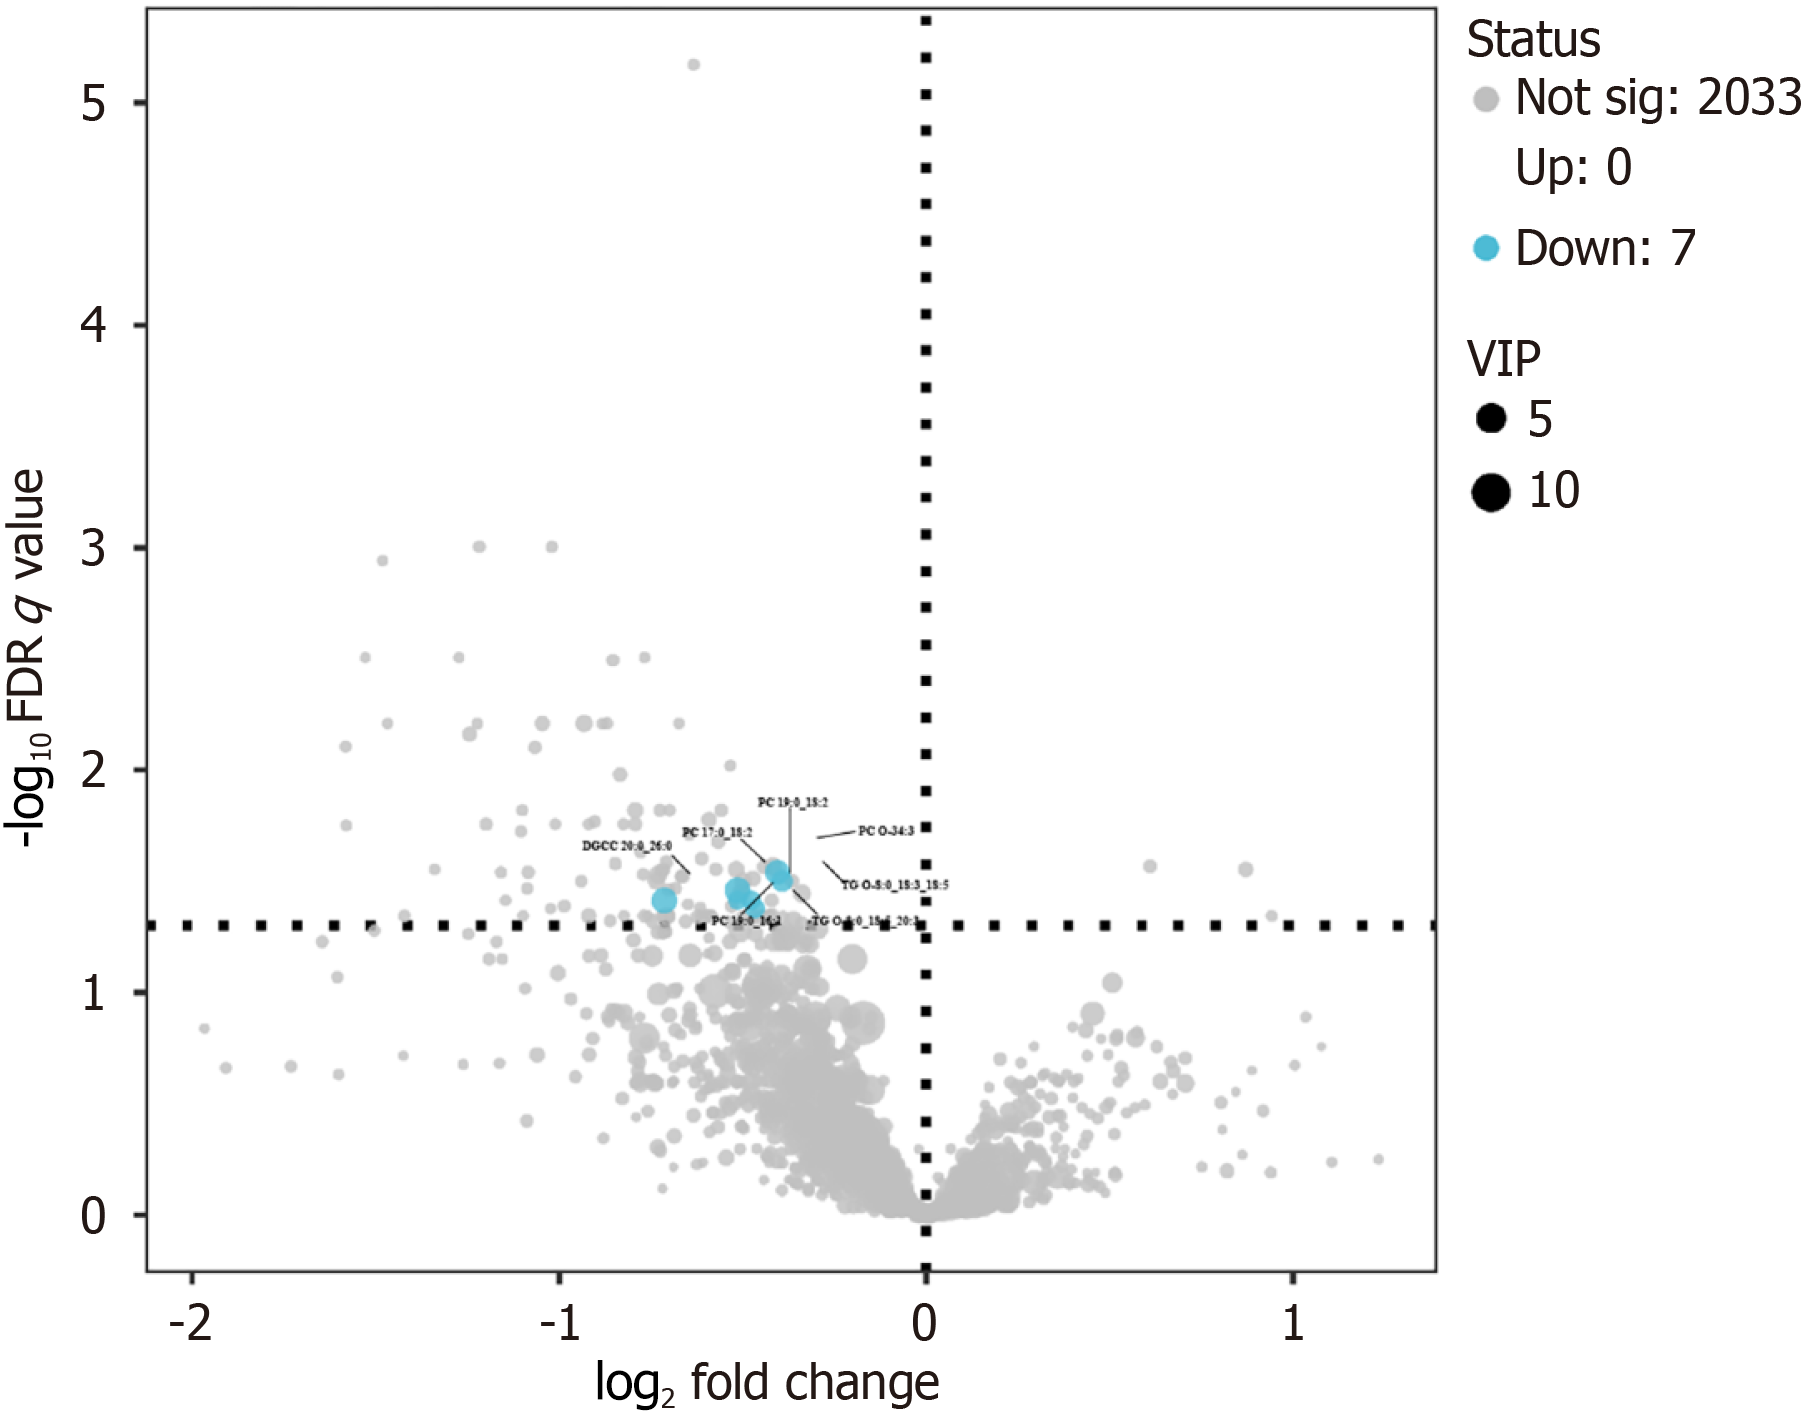
Figure 3 Volcano plot of lipid metabolite differences between the major depressive disorder and healthy control groups.
Metabolites identified via lipidomics were subjected to multivariate analysis to assess inter-group differences. Statistical significance was determined based on a combination of a variable importance in projection score > 1.0 and a false discovery rate corrected q value < 0.05. The X-axis represents log2 (fold change), and the Y-axis shows -log10 (false discovery rate q value). A total of 2033 metabolites were not significantly altered; no metabolites were up-regulated and 7 metabolites were down-regulated in the major depressive disorder group compared to healthy controls. FDR: False discovery rate; VIP: Variable importance in projection.
- Citation: Ma YH, Wang XY, Wang WL, Zhang J, Liu XH, Li DX, Zhou ZH, Chen LM, Zhou HL. Aberrant topology of the default mode network is associated with phosphatidylcholine and triglyceride levels in major depressive disorder. World J Psychiatry 2026; 16(2): 113513
- URL: https://www.wjgnet.com/2220-3206/full/v16/i2/113513.htm
- DOI: https://dx.doi.org/10.5498/wjp.v16.i2.113513