
















©The Author(s) 2026.
World J Psychiatry. Feb 19, 2026; 16(2): 113513
Published online Feb 19, 2026. doi: 10.5498/wjp.v16.i2.113513
Published online Feb 19, 2026. doi: 10.5498/wjp.v16.i2.113513
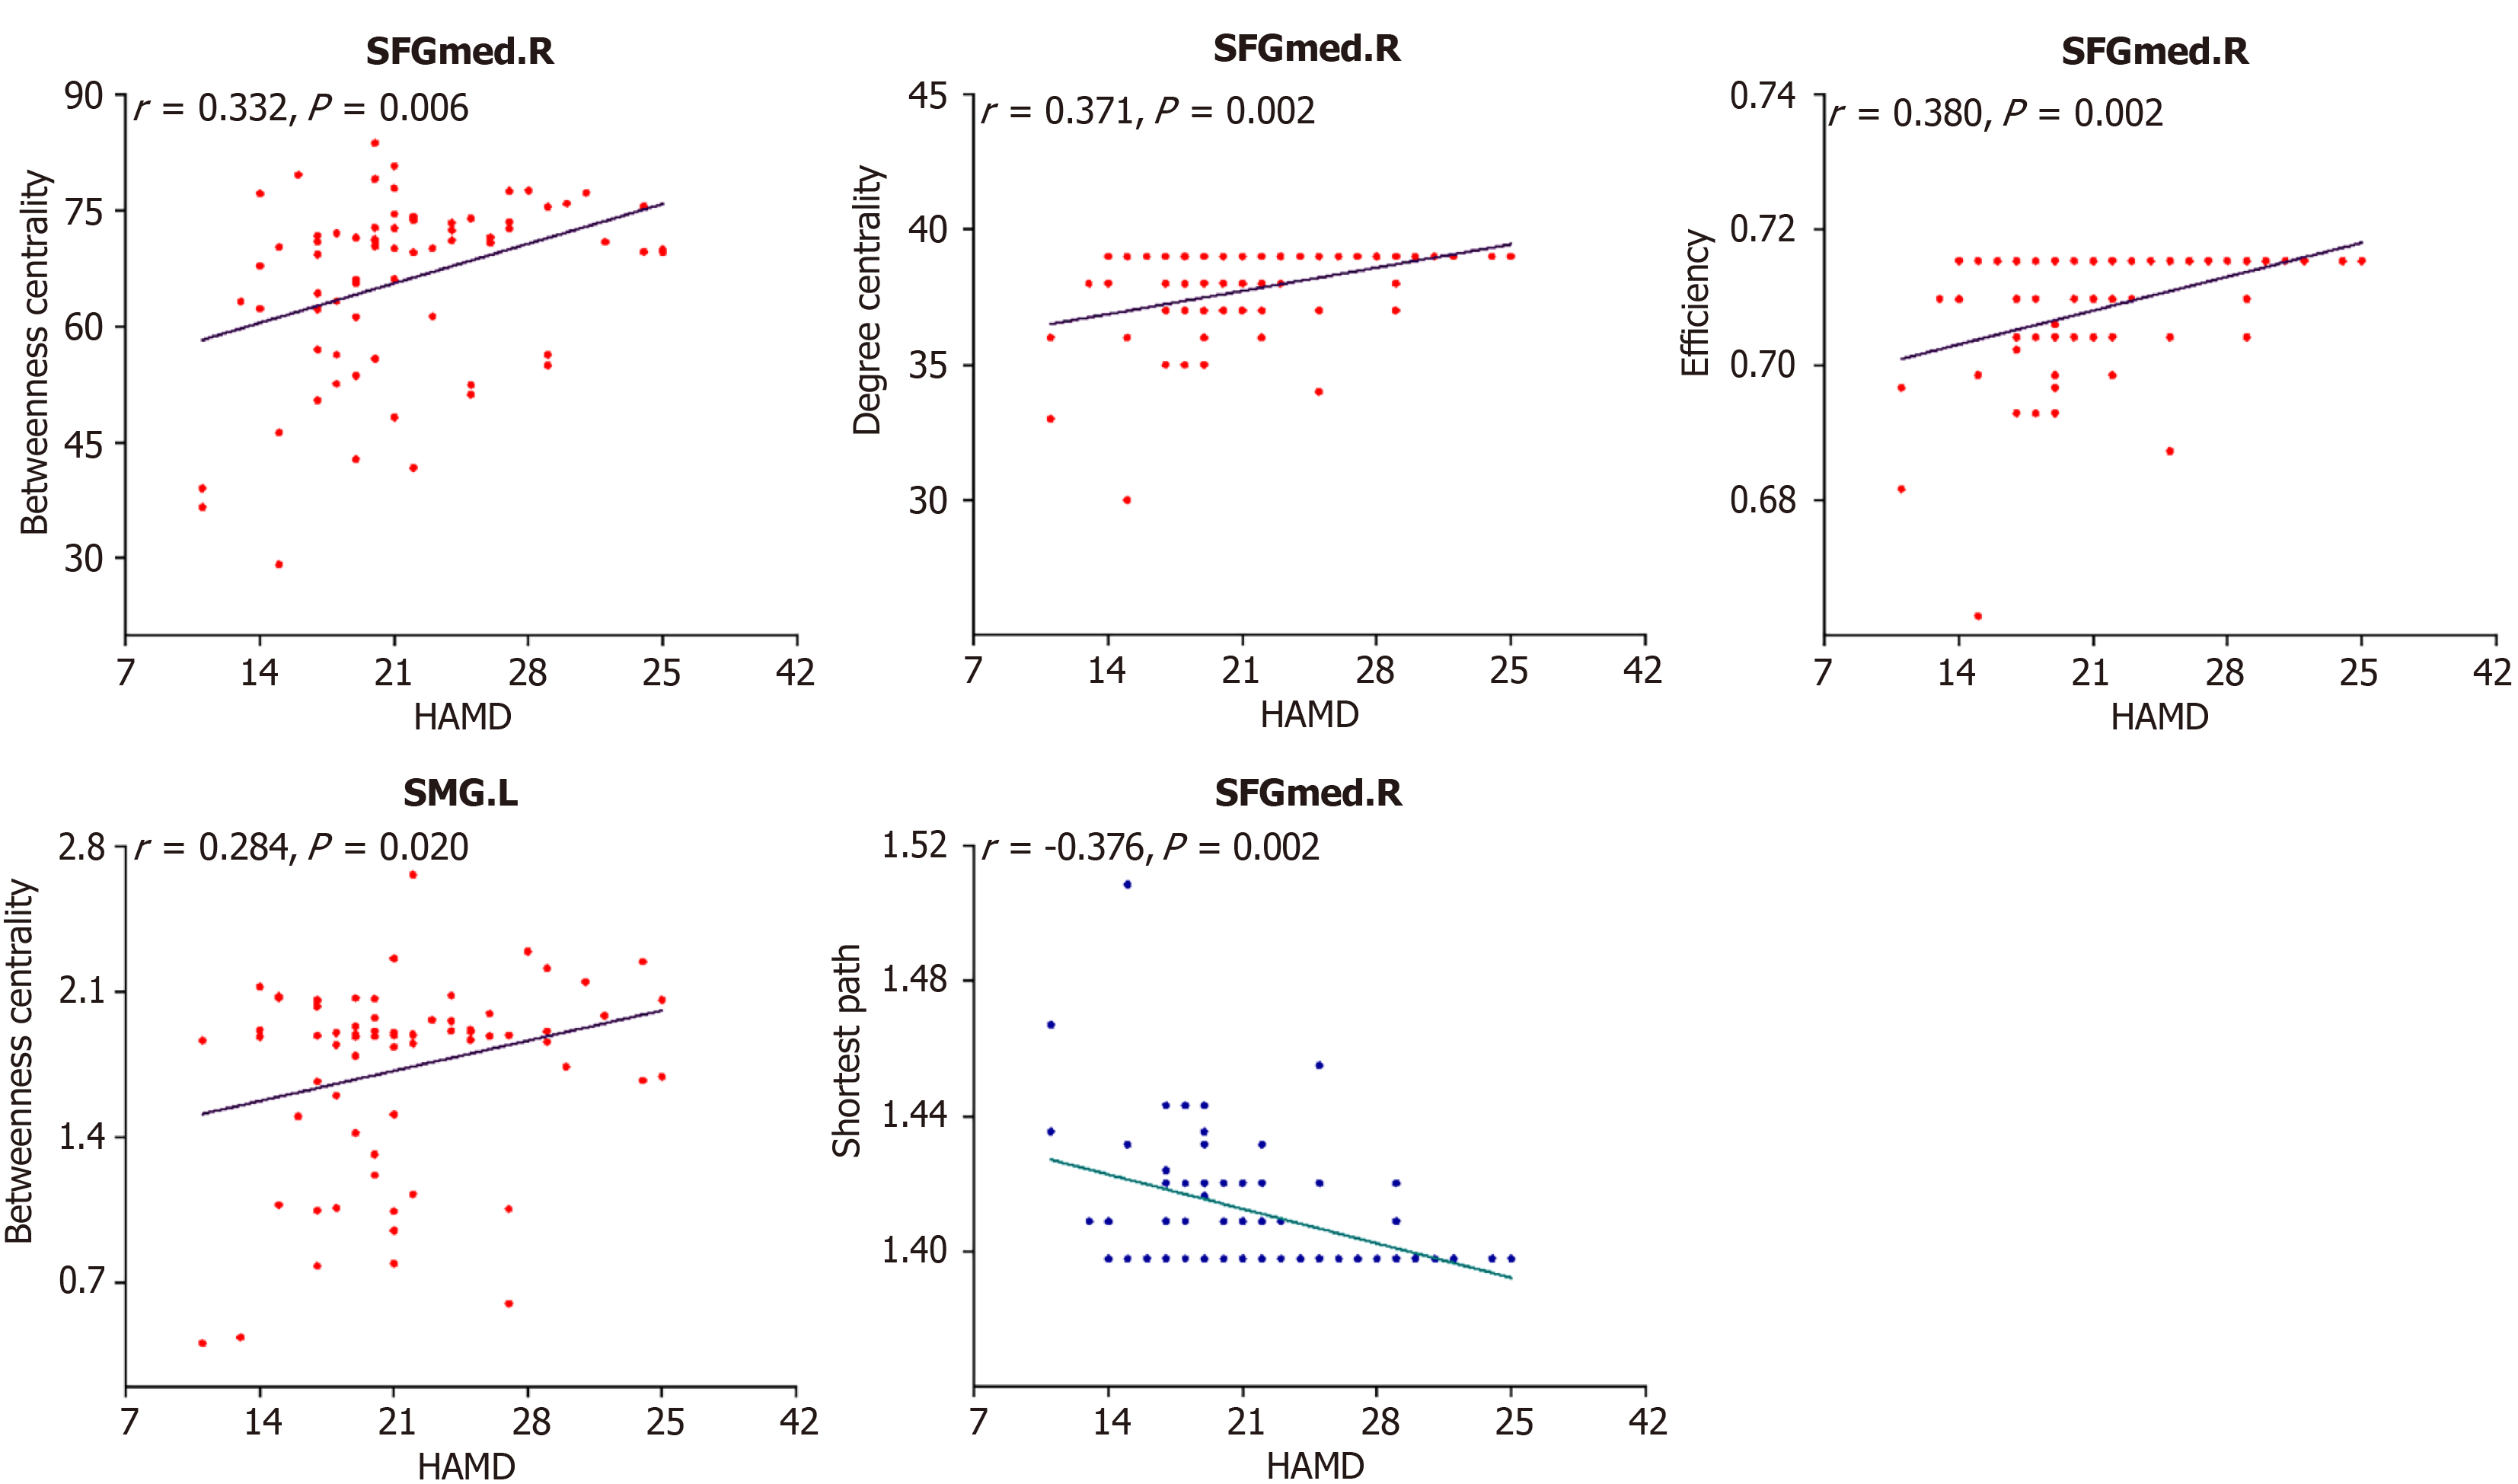
Figure 2 Scatter plots of correlations between abnormal topological properties of the default mode network nodes and Hamilton Depression Rating Scale scores in patients with major depressive disorder.
Red spots represent positive correlations between abnormal topological properties of the default mode network nodes and 17-item Hamilton Depression Rating Scale scores. Blue spots represent negative correlations between abnormal topological properties of the default mode network nodes and 17-item Hamilton Depression Rating Scale scores. SFGmed.R: Right medial superior frontal gyrus; HAMD: Hamilton Depression Rating Scale; SMG.L: Left supramarginal gyrus.
- Citation: Ma YH, Wang XY, Wang WL, Zhang J, Liu XH, Li DX, Zhou ZH, Chen LM, Zhou HL. Aberrant topology of the default mode network is associated with phosphatidylcholine and triglyceride levels in major depressive disorder. World J Psychiatry 2026; 16(2): 113513
- URL: https://www.wjgnet.com/2220-3206/full/v16/i2/113513.htm
- DOI: https://dx.doi.org/10.5498/wjp.v16.i2.113513