
















©The Author(s) 2026.
World J Psychiatry. Feb 19, 2026; 16(2): 111050
Published online Feb 19, 2026. doi: 10.5498/wjp.v16.i2.111050
Published online Feb 19, 2026. doi: 10.5498/wjp.v16.i2.111050
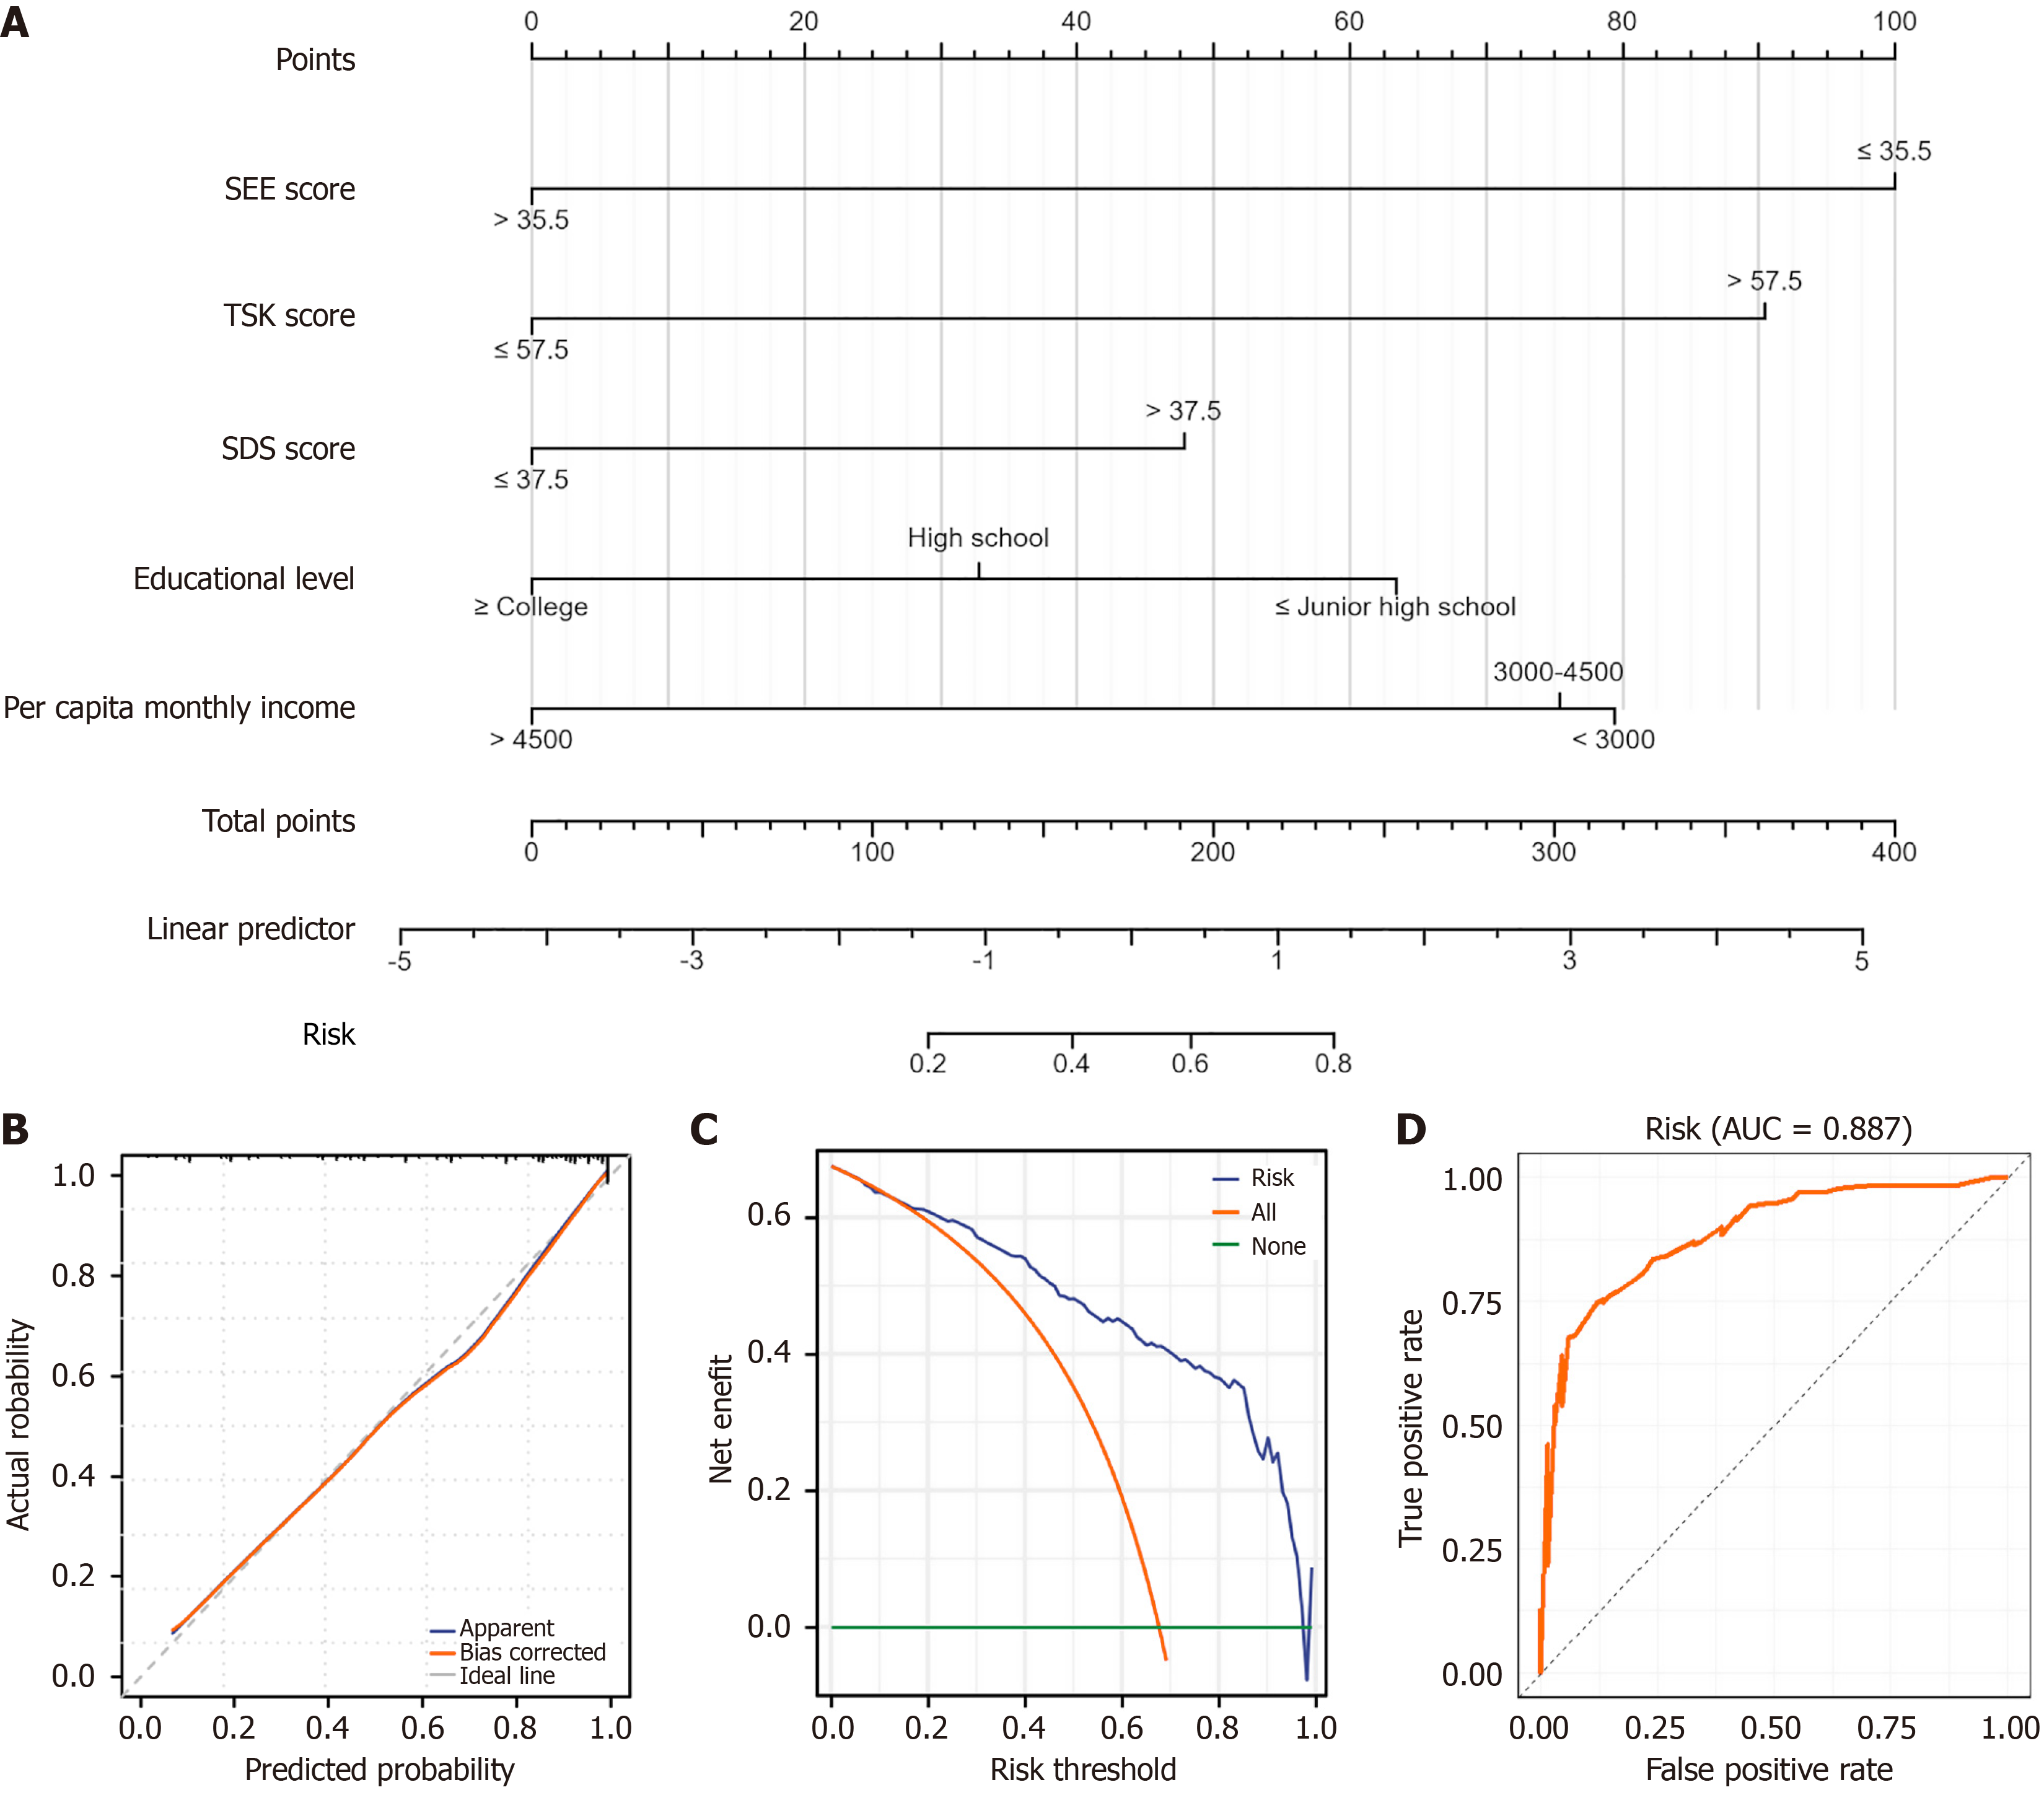
Figure 3 Construction and evaluation of the exercise anxiety predictive model.
A: Line graph of the exercise anxiety prediction model; B: Calibration curve to assess the stability of the predictive model; C: Decision curve analysis model to assess the clinical benefit rate of the prediction model; D: Receiver operating characteristic curve to assess the predictive efficacy of the prediction model. SEE: Self-Efficacy for Exercise Scale; TSK: Tampa Scale for Kinesiophobia; SDS: Self-Rating Depression Scale; AUC: Area under the curve.
- Citation: Yang YB, Tang LP, Yu CY, Fu CL, Yang JP. Impact of motor anxiety on rehabilitation in elderly stroke patients: A retrospective study. World J Psychiatry 2026; 16(2): 111050
- URL: https://www.wjgnet.com/2220-3206/full/v16/i2/111050.htm
- DOI: https://dx.doi.org/10.5498/wjp.v16.i2.111050