















©The Author(s) 2026.
World J Psychiatry. Feb 19, 2026; 16(2): 111012
Published online Feb 19, 2026. doi: 10.5498/wjp.v16.i2.111012
Published online Feb 19, 2026. doi: 10.5498/wjp.v16.i2.111012
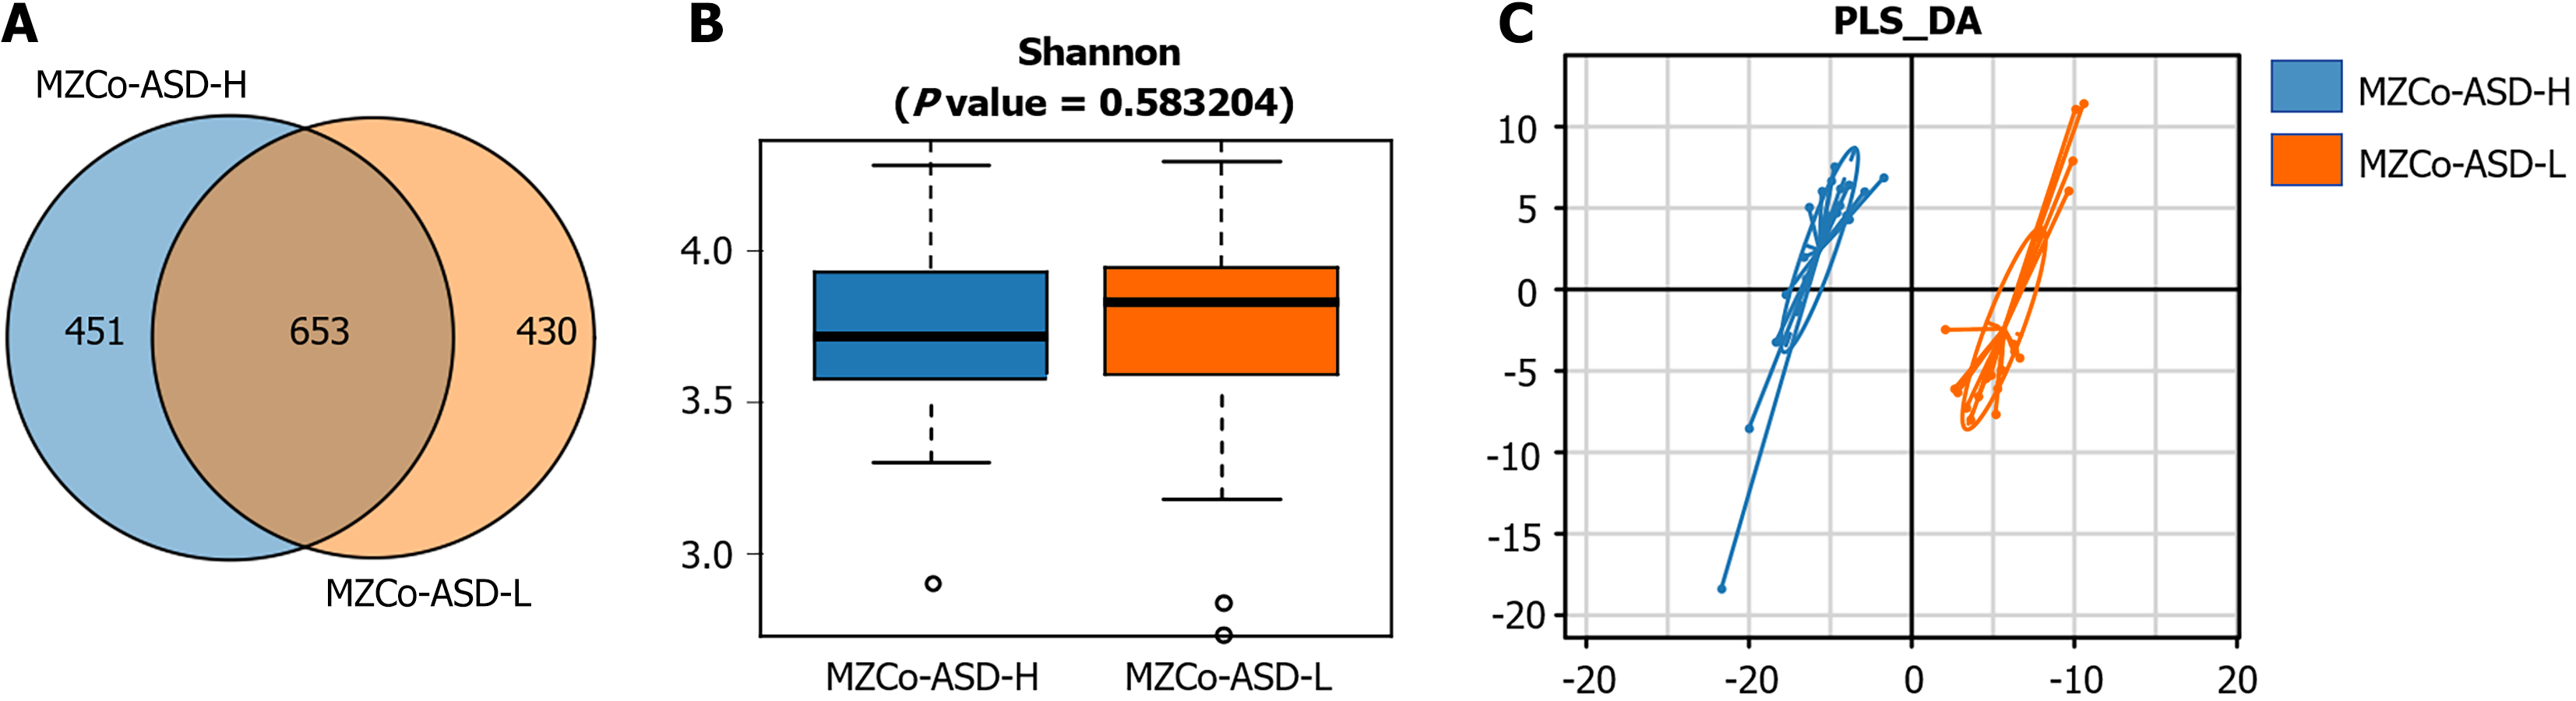
Figure 2 Species composition analysis of severe monozygotic twins with autism spectrum disorder and monozygotic twins with autism spectrum disorder-mild groups.
A: Venn diagram highlights the overlapping area representing shared operational taxonomic unit between the two groups; B: The alpha diversity of the severe monozygotic twins with autism spectrum disorder group (blue) and the monozygotic twins with autism spectrum disorder-mild group (orange); C: The beta diversity of severe monozygotic twins with autism spectrum disorder group (blue) and the monozygotic twins with autism spectrum disorder-mild group (orange). The distance between the two groups reflects their similarity. MZCo-ASD-H: Severe monozygotic twins with autism spectrum disorder; MZCo-ASD-L: Monozygotic twins with autism spectrum disorder-mild group; PLS-DA: Partial least squares discriminant analysis.
- Citation: Huang YY, Li CY, Li Y, Fang H, Ke XY. Characteristics and functions of the gut microbiome in monozygotic twins with autism spectrum disorders of varying severity. World J Psychiatry 2026; 16(2): 111012
- URL: https://www.wjgnet.com/2220-3206/full/v16/i2/111012.htm
- DOI: https://dx.doi.org/10.5498/wjp.v16.i2.111012