
















Copyright: ©Author(s) 2026.
World J Psychiatry. Nov 19, 2026; 16(11): 123531
Published online Nov 19, 2026. doi: 10.5498/wjp.123531
Published online Nov 19, 2026. doi: 10.5498/wjp.123531
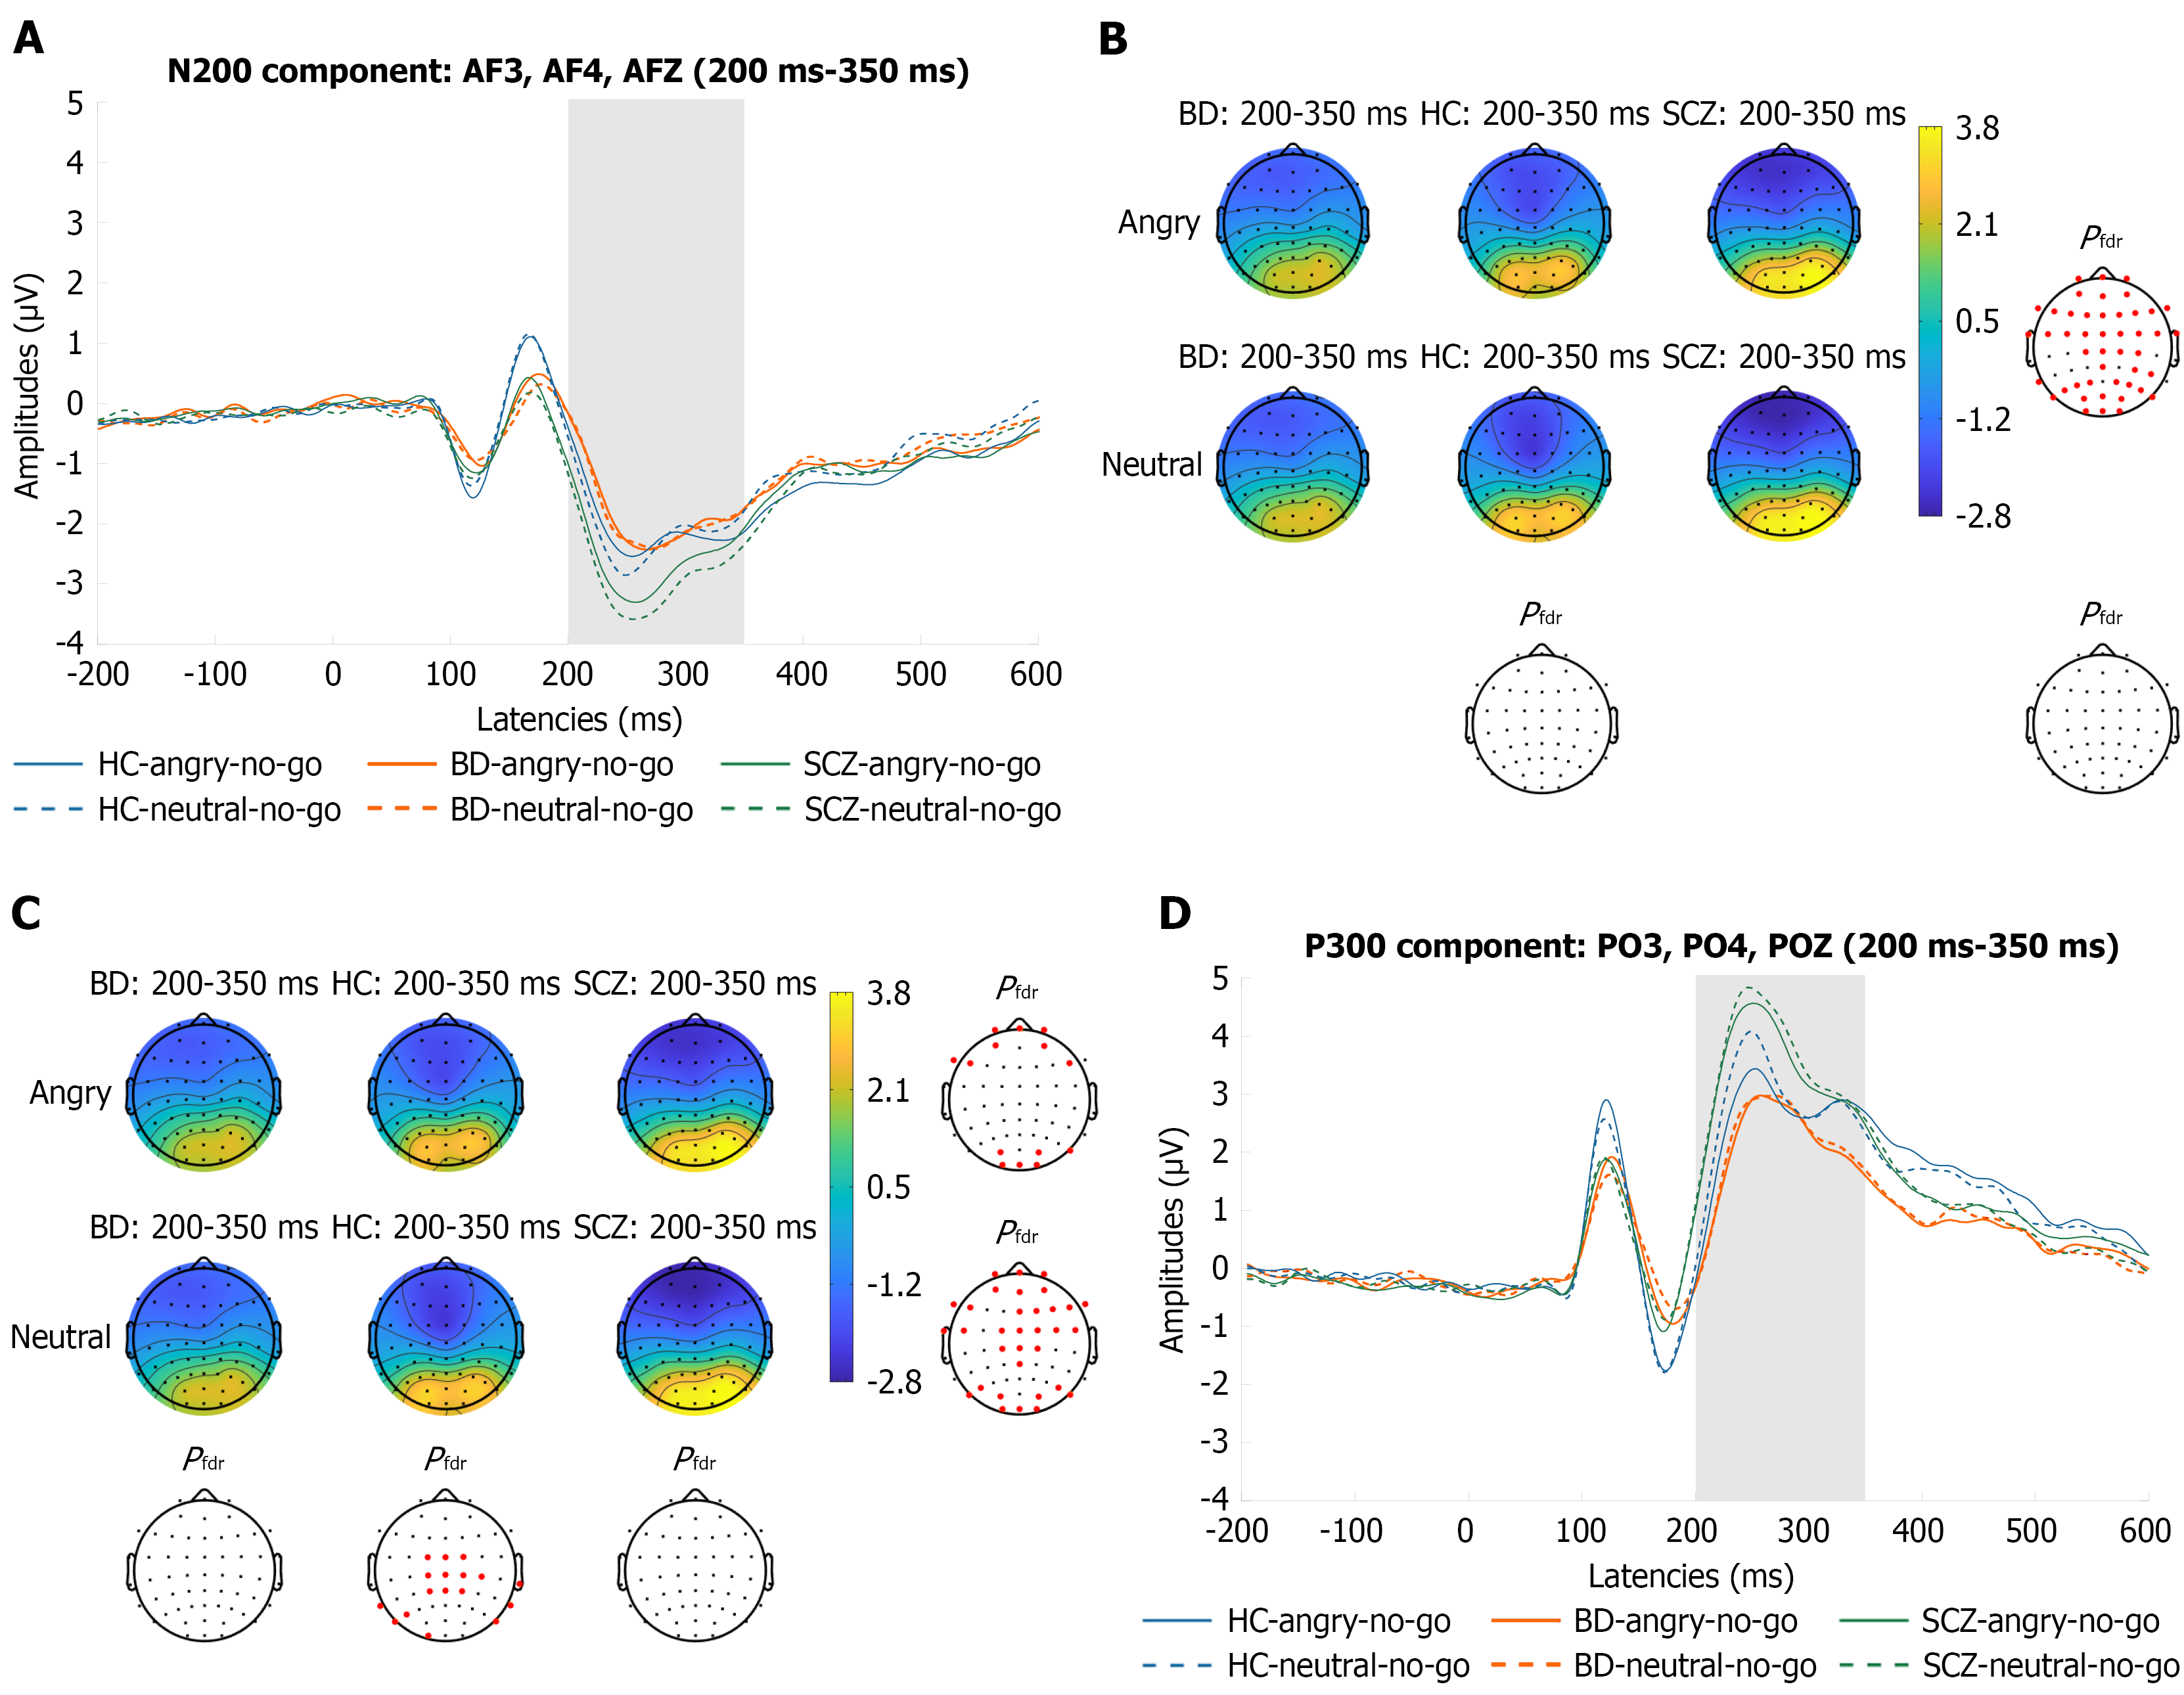
Figure 4 The significant differences of N200 and P300 in different emotion types between three groups.
A: For the no-go stimulus condition, the N200 mean amplitudes in the 200-350 milliseconds time window over prefrontal region (AF3, AF4, AFZ) across group [schizophrenia group (SCZ) vs bipolar disorder group (BD) vs healthy control group (HC)] × face type (angry vs neutral); B and C: For the N200 and P300, the difference topographic maps of emotion types within the healthy control group as well as the difference topographic maps of both emotion types within group (SCZ vs BD vs HC); D: For the no-go stimulus condition, the P300 mean amplitudes in the 200-350 milliseconds time window over occipital region (PO3, PO4, POz) across group (SCZ vs BD vs HC) × face type (angry vs neutral). Electrodes marked with red color indicate a significant group-difference. HC: Healthy control group; BD: Bipolar disorder group; SCZ: Schizophrenia group.
- Citation: Li XP, Zhang J, Liu Q, Wu YQ, Yang WY, Li JX, Liu XH, Sun YF, Zhou HL, Zhou ZH, Dai ZZ, Wang XY. Neural correlates of aggressive impulsive behavior differ between schizophrenia and bipolar disorder: An event-related potential study with a go/no-go task. World J Psychiatry 2026; 16(11): 123531
- URL: https://www.wjgnet.com/2220-3206/full/v16/i11/123531.htm
- DOI: https://dx.doi.org/10.5498/wjp.123531