
















Copyright: ©Author(s) 2026.
World J Psychiatry. Oct 19, 2026; 16(10): 123156
Published online Oct 19, 2026. doi: 10.5498/wjp.123156
Published online Oct 19, 2026. doi: 10.5498/wjp.123156
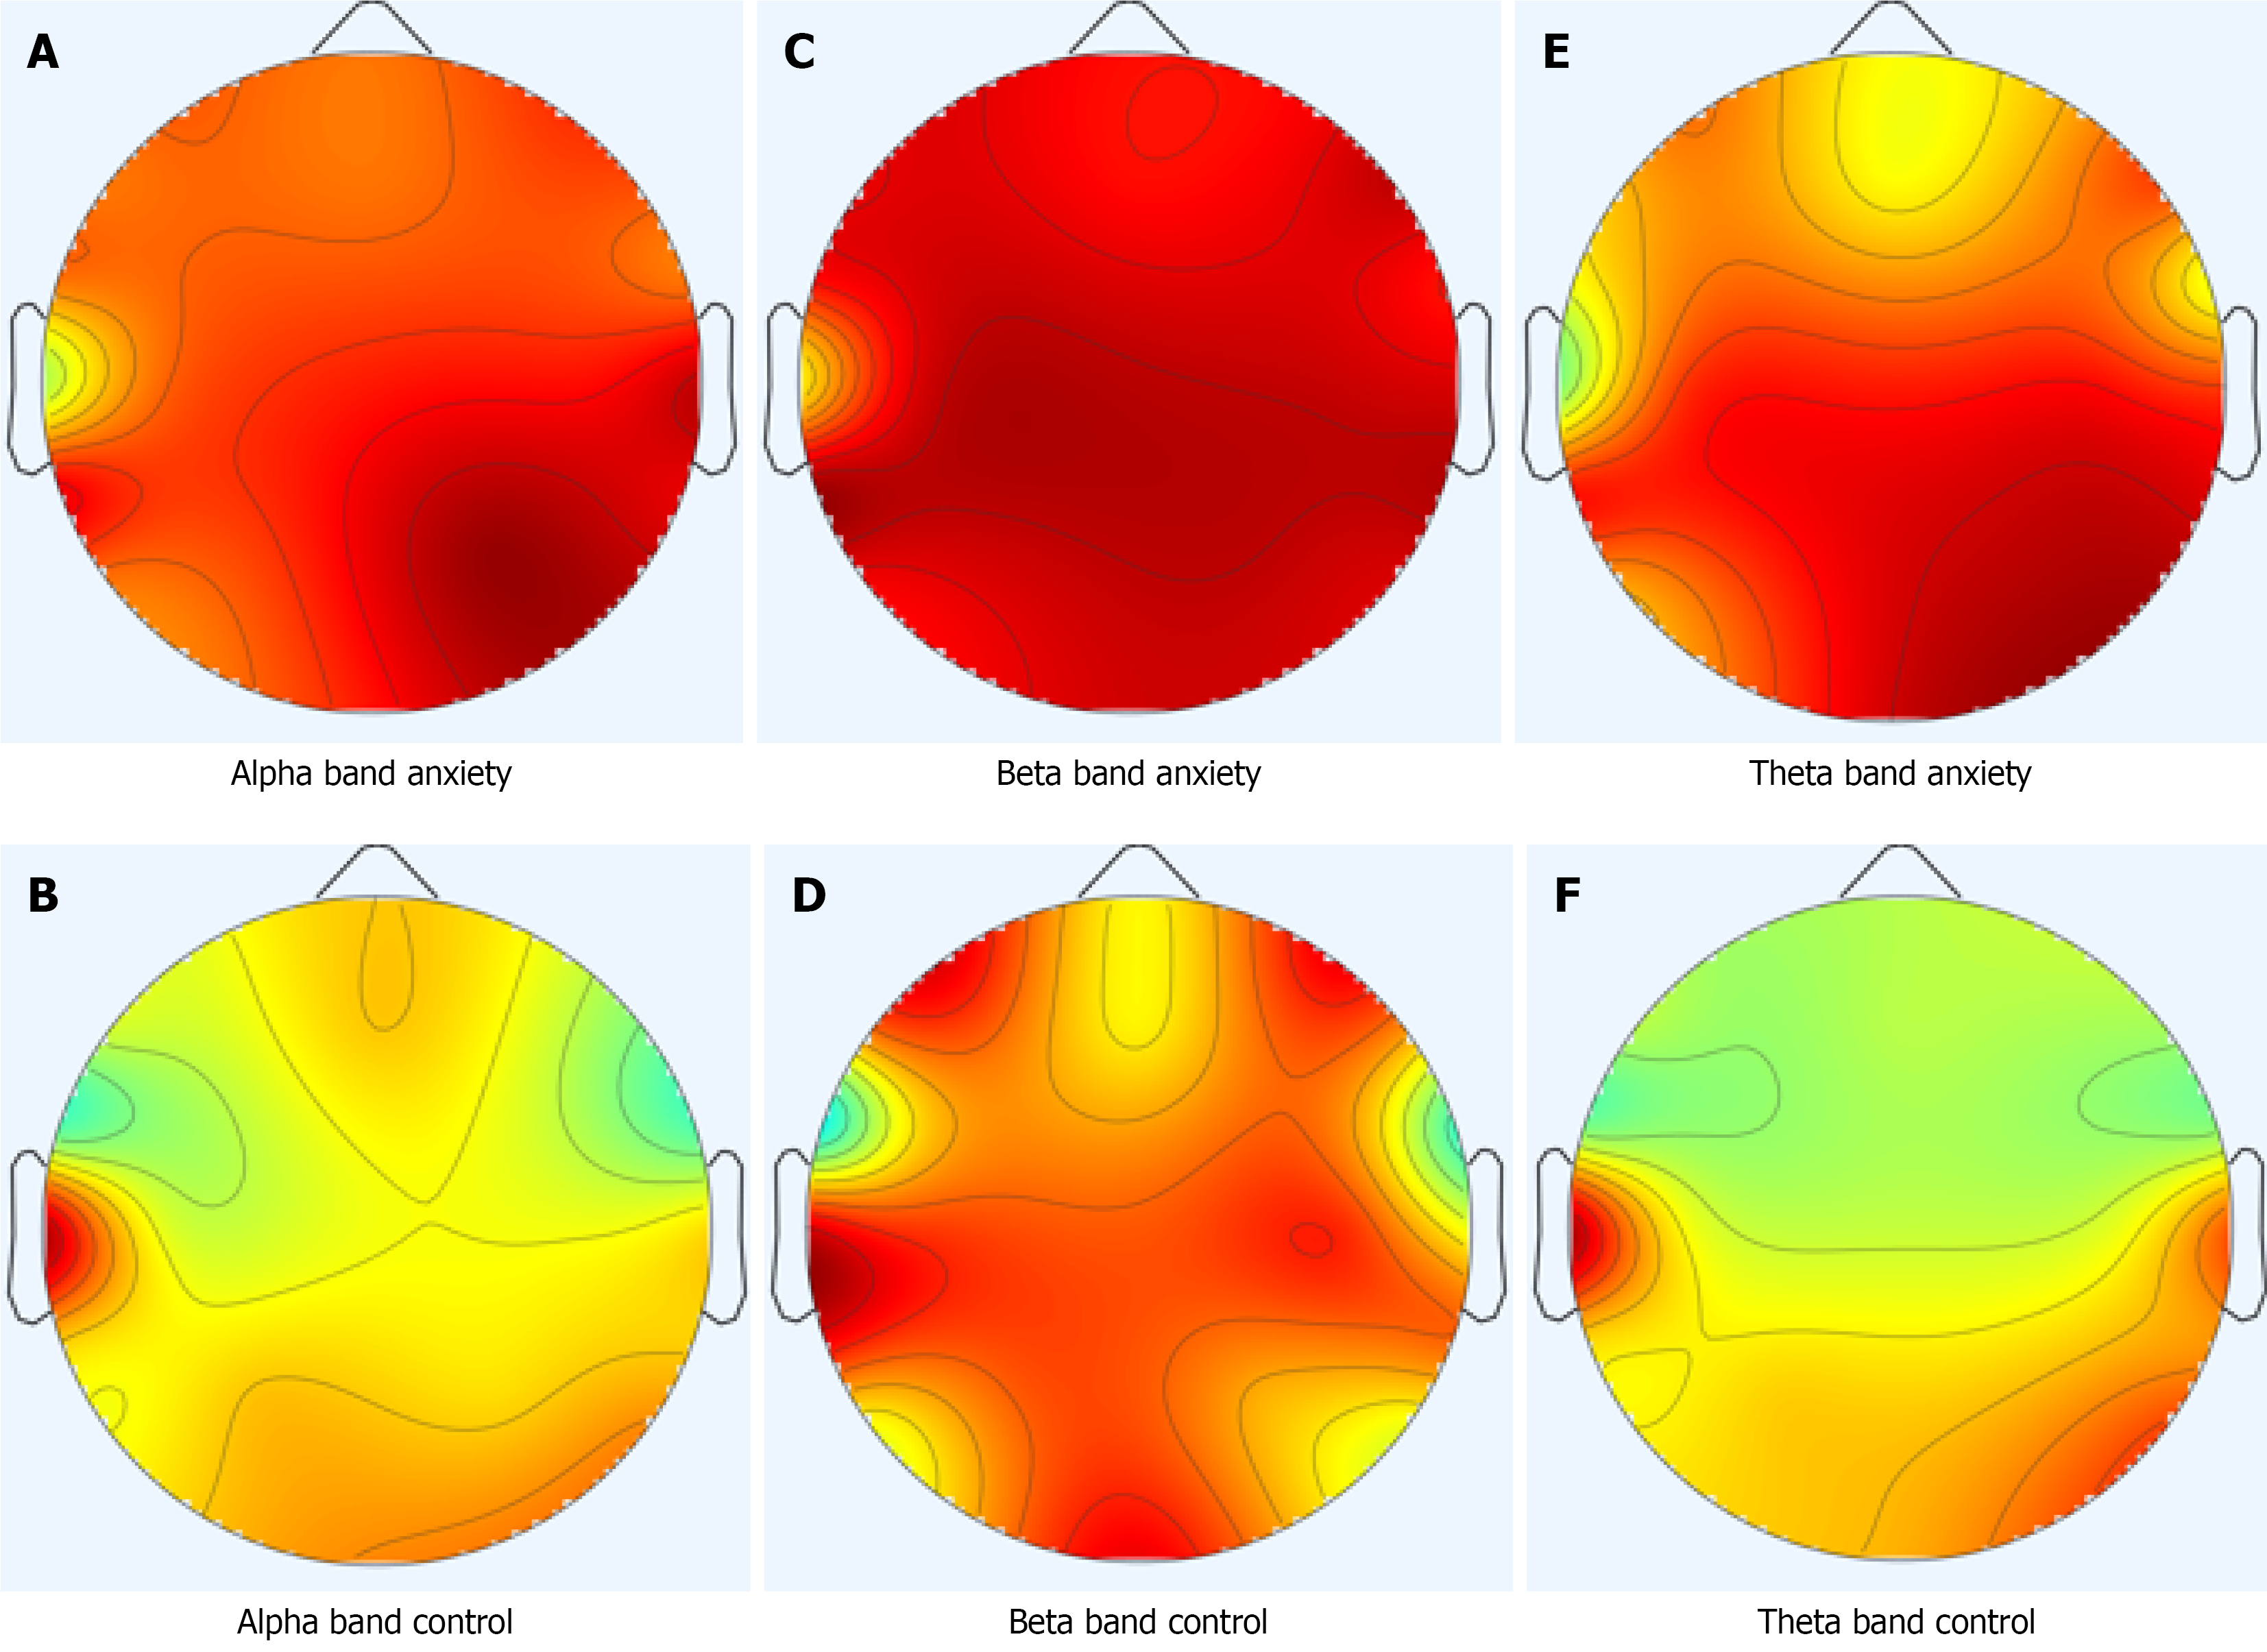
Figure 2 Representative electroencephalography topographic map images generated from different frequency bands.
The first line shows examples from the anxiety class, whereas the second line shows examples from the control class. Each row corresponds to a specific electroencephalography frequency band. A: Alpha band anxiety; B: Alpha band control; C: Beta band anxiety; D: Beta band control; E: Theta band anxiety; F: Theta band control.
- Citation: Kaya S, Tasci G, Tuncer İ, Tasci B, Baygın N, Tasci I, Baygin M, Dogan S, Tuncer T. FusedNeXt-based anxiety detection from electroencephalography topographic maps: A comparative analysis of alpha, beta, and theta bands. World J Psychiatry 2026; 16(10): 123156
- URL: https://www.wjgnet.com/2220-3206/full/v16/i10/123156.htm
- DOI: https://dx.doi.org/10.5498/wjp.123156