
















Copyright: ©Author(s) 2026.
World J Psychiatry. Oct 19, 2026; 16(10): 121996
Published online Oct 19, 2026. doi: 10.5498/wjp.121996
Published online Oct 19, 2026. doi: 10.5498/wjp.121996
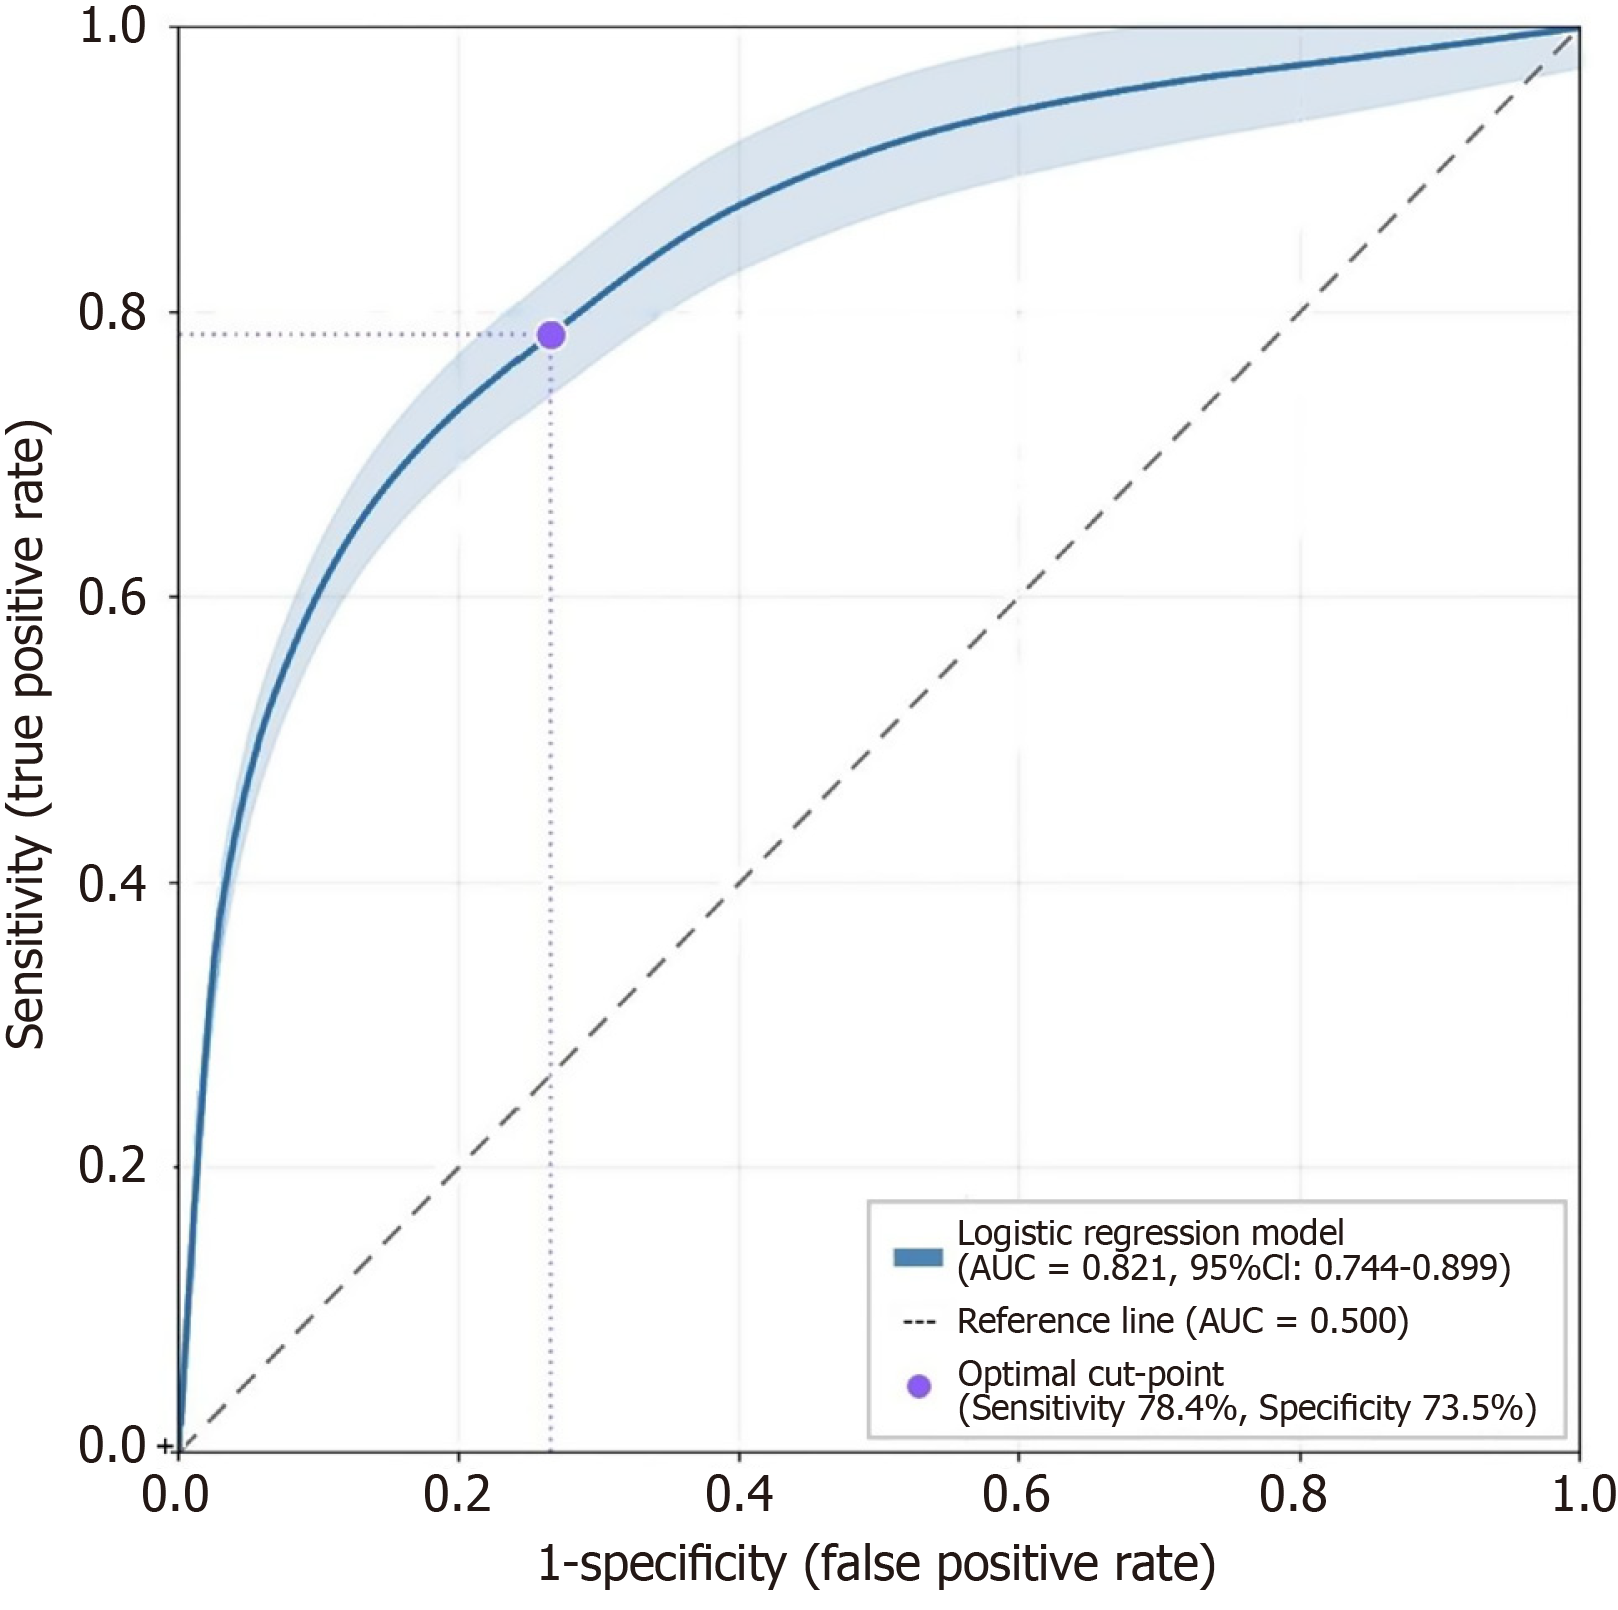
Figure 1 Receiver operating characteristic curve for the multivariate logistic regression model predicting clinical pregnancy.
The model included Self-Rating Anxiety Scale score, Fertility Quality of Life Scale score, residual myometrial thickness, cesarean scar defect severity (mild vs severe), co-morbid anxiety and depression, and spousal support score. Area under the curve = 0.821 (95% confidence interval: 0.744-0.899). The diagonal dashed line represents chance-level discrimination. The optimal threshold (sensitivity 78.4%, specificity 73.5%) is indicated by the filled circle. AUC: Area under the curve; CI: Confidence interval.
- Citation: Lin XB, Luo LL, Chen YX, Li YP, You HM, Chen XF, Wei QP, Zhang QY, Huang XL. Prognostic factors of depression and anxiety in infertile women with cesarean scar defects. World J Psychiatry 2026; 16(10): 121996
- URL: https://www.wjgnet.com/2220-3206/full/v16/i10/121996.htm
- DOI: https://dx.doi.org/10.5498/wjp.121996