















Copyright: ©Author(s) 2026.
World J Psychiatry. Oct 19, 2026; 16(10): 121968
Published online Oct 19, 2026. doi: 10.5498/wjp.121968
Published online Oct 19, 2026. doi: 10.5498/wjp.121968
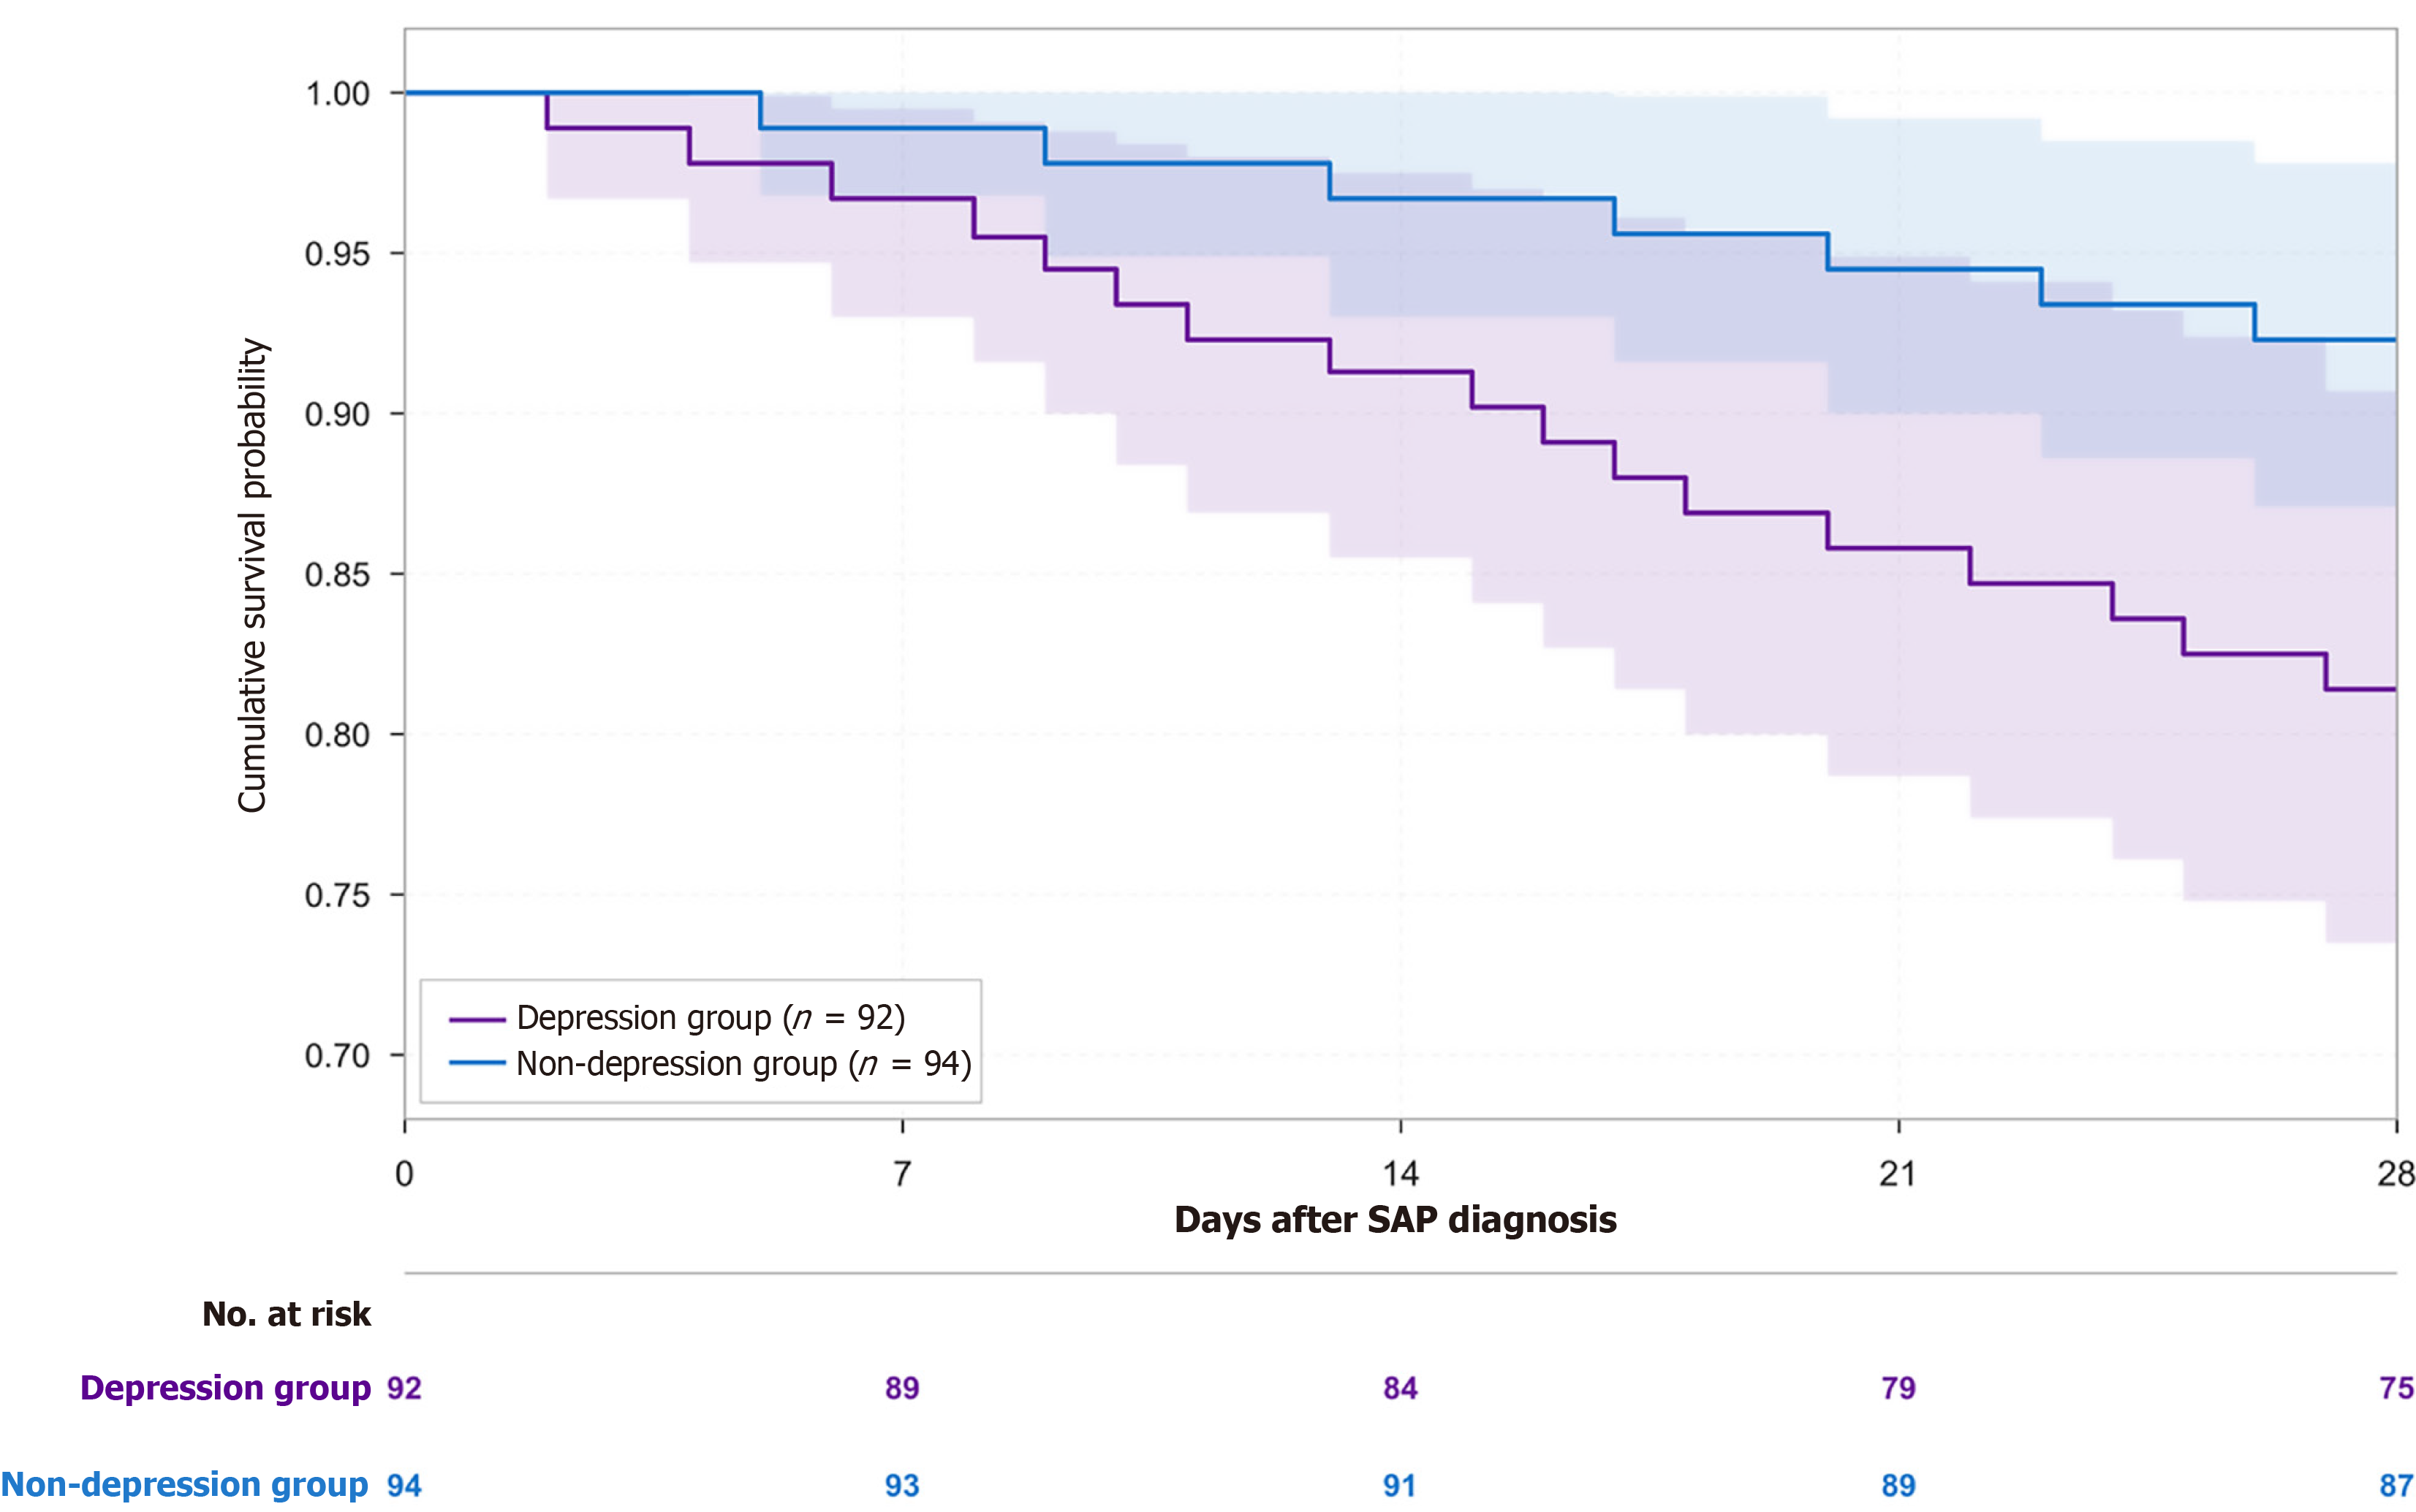
Figure 3 Kaplan-Meier 28-day survival curves comparing the depression group (n = 92) and non-depression group (n = 94) among stroke-associated pneumonia patients.
The depression group demonstrated significantly higher mortality (18.5% vs 7.4%; log-rank P = 0.018). Survival curves diverged after day 7, with the number at risk shown below the plot. SAP: Stroke-associated pneumonia.
- Citation: Zhang HL, Liu J, Wei K, Hu CN, Wang XJ, Han QL, Wang LC. Impact of post-stroke depression on the prognosis of stroke-associated pneumonia and analysis of predictive factors: A retrospective study of 186 patients. World J Psychiatry 2026; 16(10): 121968
- URL: https://www.wjgnet.com/2220-3206/full/v16/i10/121968.htm
- DOI: https://dx.doi.org/10.5498/wjp.121968