
















Copyright: ©Author(s) 2026.
World J Psychiatry. Oct 19, 2026; 16(10): 121314
Published online Oct 19, 2026. doi: 10.5498/wjp.121314
Published online Oct 19, 2026. doi: 10.5498/wjp.121314
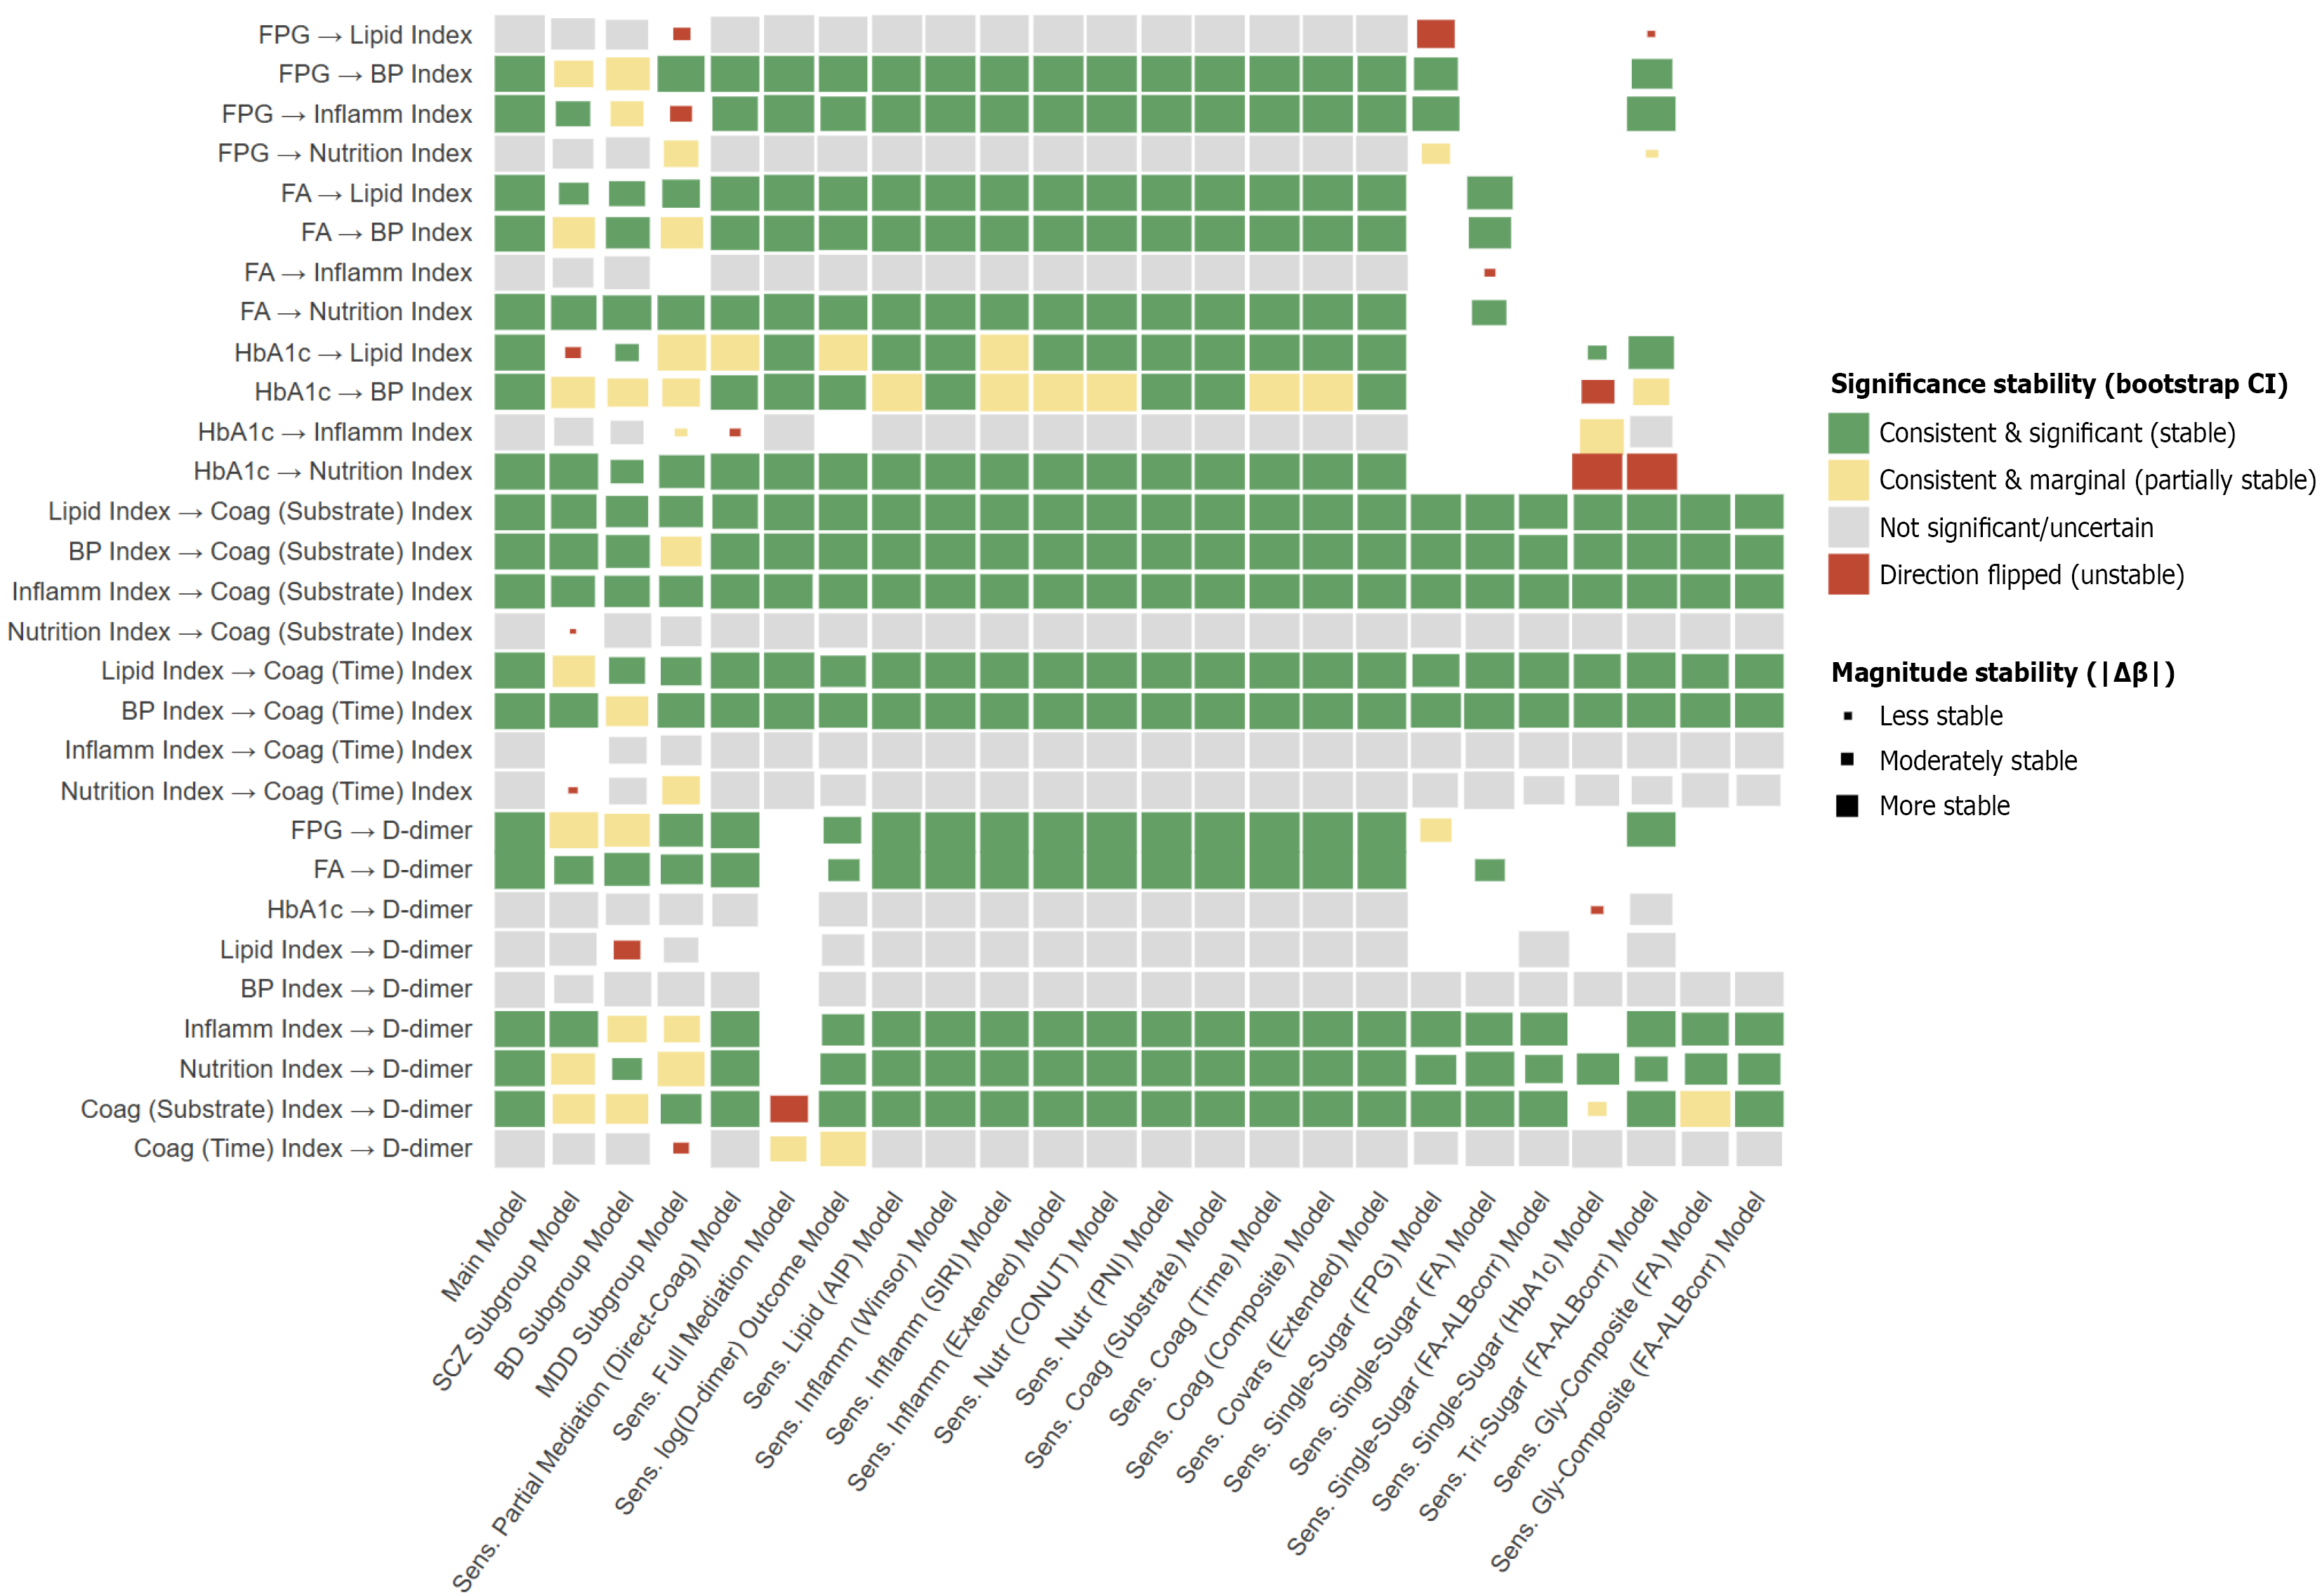
Figure 8 Heatmap of structural pathway stability across the main model and multiple sensitivity analyses.
This heatmap summarizes the stability of each retained structural path (rows) across the main model and all subgroup/sensitivity models (columns). For each model-path cell, the standardized path coefficient (β) and its bootstrap 95% confidence interval (CI) were compared with the corresponding coefficient in the main model (baseline). Statistical significance was defined as a CI that does not cross zero: A path was considered significant if the CI lower > 0 or the CI upper < 0; otherwise, it was treated as non-significant or uncertain. Direction was determined from the sign of β (with a near-zero tolerance ε = 1 × 10⁻12): Β > ε (positive), β < -ε (negative), and |β| ≤ ε (zero/neutral). Direction consistency was defined as “same direction” when the current sign matched the baseline sign, or when either sign was zero (i.e., baseline = 0 or current = 0 was treated as direction-compatible). A direction flip was flagged when both baseline and current signs were non-zero and opposite (sign_baseline ≠ sign_current). Cells were assigned to four stability classes (tile color): (1) Consistent and significant (stable): Direction compatible and both baseline and current paths significant; (2) Consistent and marginal (partially stable): Direction compatible but statistical significance differed between baseline and current (exactly one significant); (3) Not significant/uncertain: All remaining non-flipped cases, including when both paths were non-significant; and (4) Direction flipped (unstable): Opposite non-zero signs between baseline and current. To quantify magnitude stability, the change in standardized coefficient relative to baseline was computed as Δβ = β_current - β_baseline, and its absolute value |Δβ| was used for visualization. |Δβ| was clipped at 0.20 (DELTA MAX = 0.20). Tile size encodes magnitude stability in a direction-dependent manner: For direction-consistent paths, tile size decreases with increasing |Δβ|, whereas for direction-flipped paths, tile size increases with increasing |Δβ|. Cells with missing coefficients or unavailable paths were not drawn to avoid visual misinterpretation.
- Citation: Wei J, Du HY, He Q, Jia SS, Luo FG, Wang YC. Glycemic indicators influence hypercoagulability via multisystem pathways in psychiatric inpatients: Structural equation modeling. World J Psychiatry 2026; 16(10): 121314
- URL: https://www.wjgnet.com/2220-3206/full/v16/i10/121314.htm
- DOI: https://dx.doi.org/10.5498/wjp.121314