
















Copyright: ©Author(s) 2026.
World J Psychiatry. Oct 19, 2026; 16(10): 121314
Published online Oct 19, 2026. doi: 10.5498/wjp.121314
Published online Oct 19, 2026. doi: 10.5498/wjp.121314
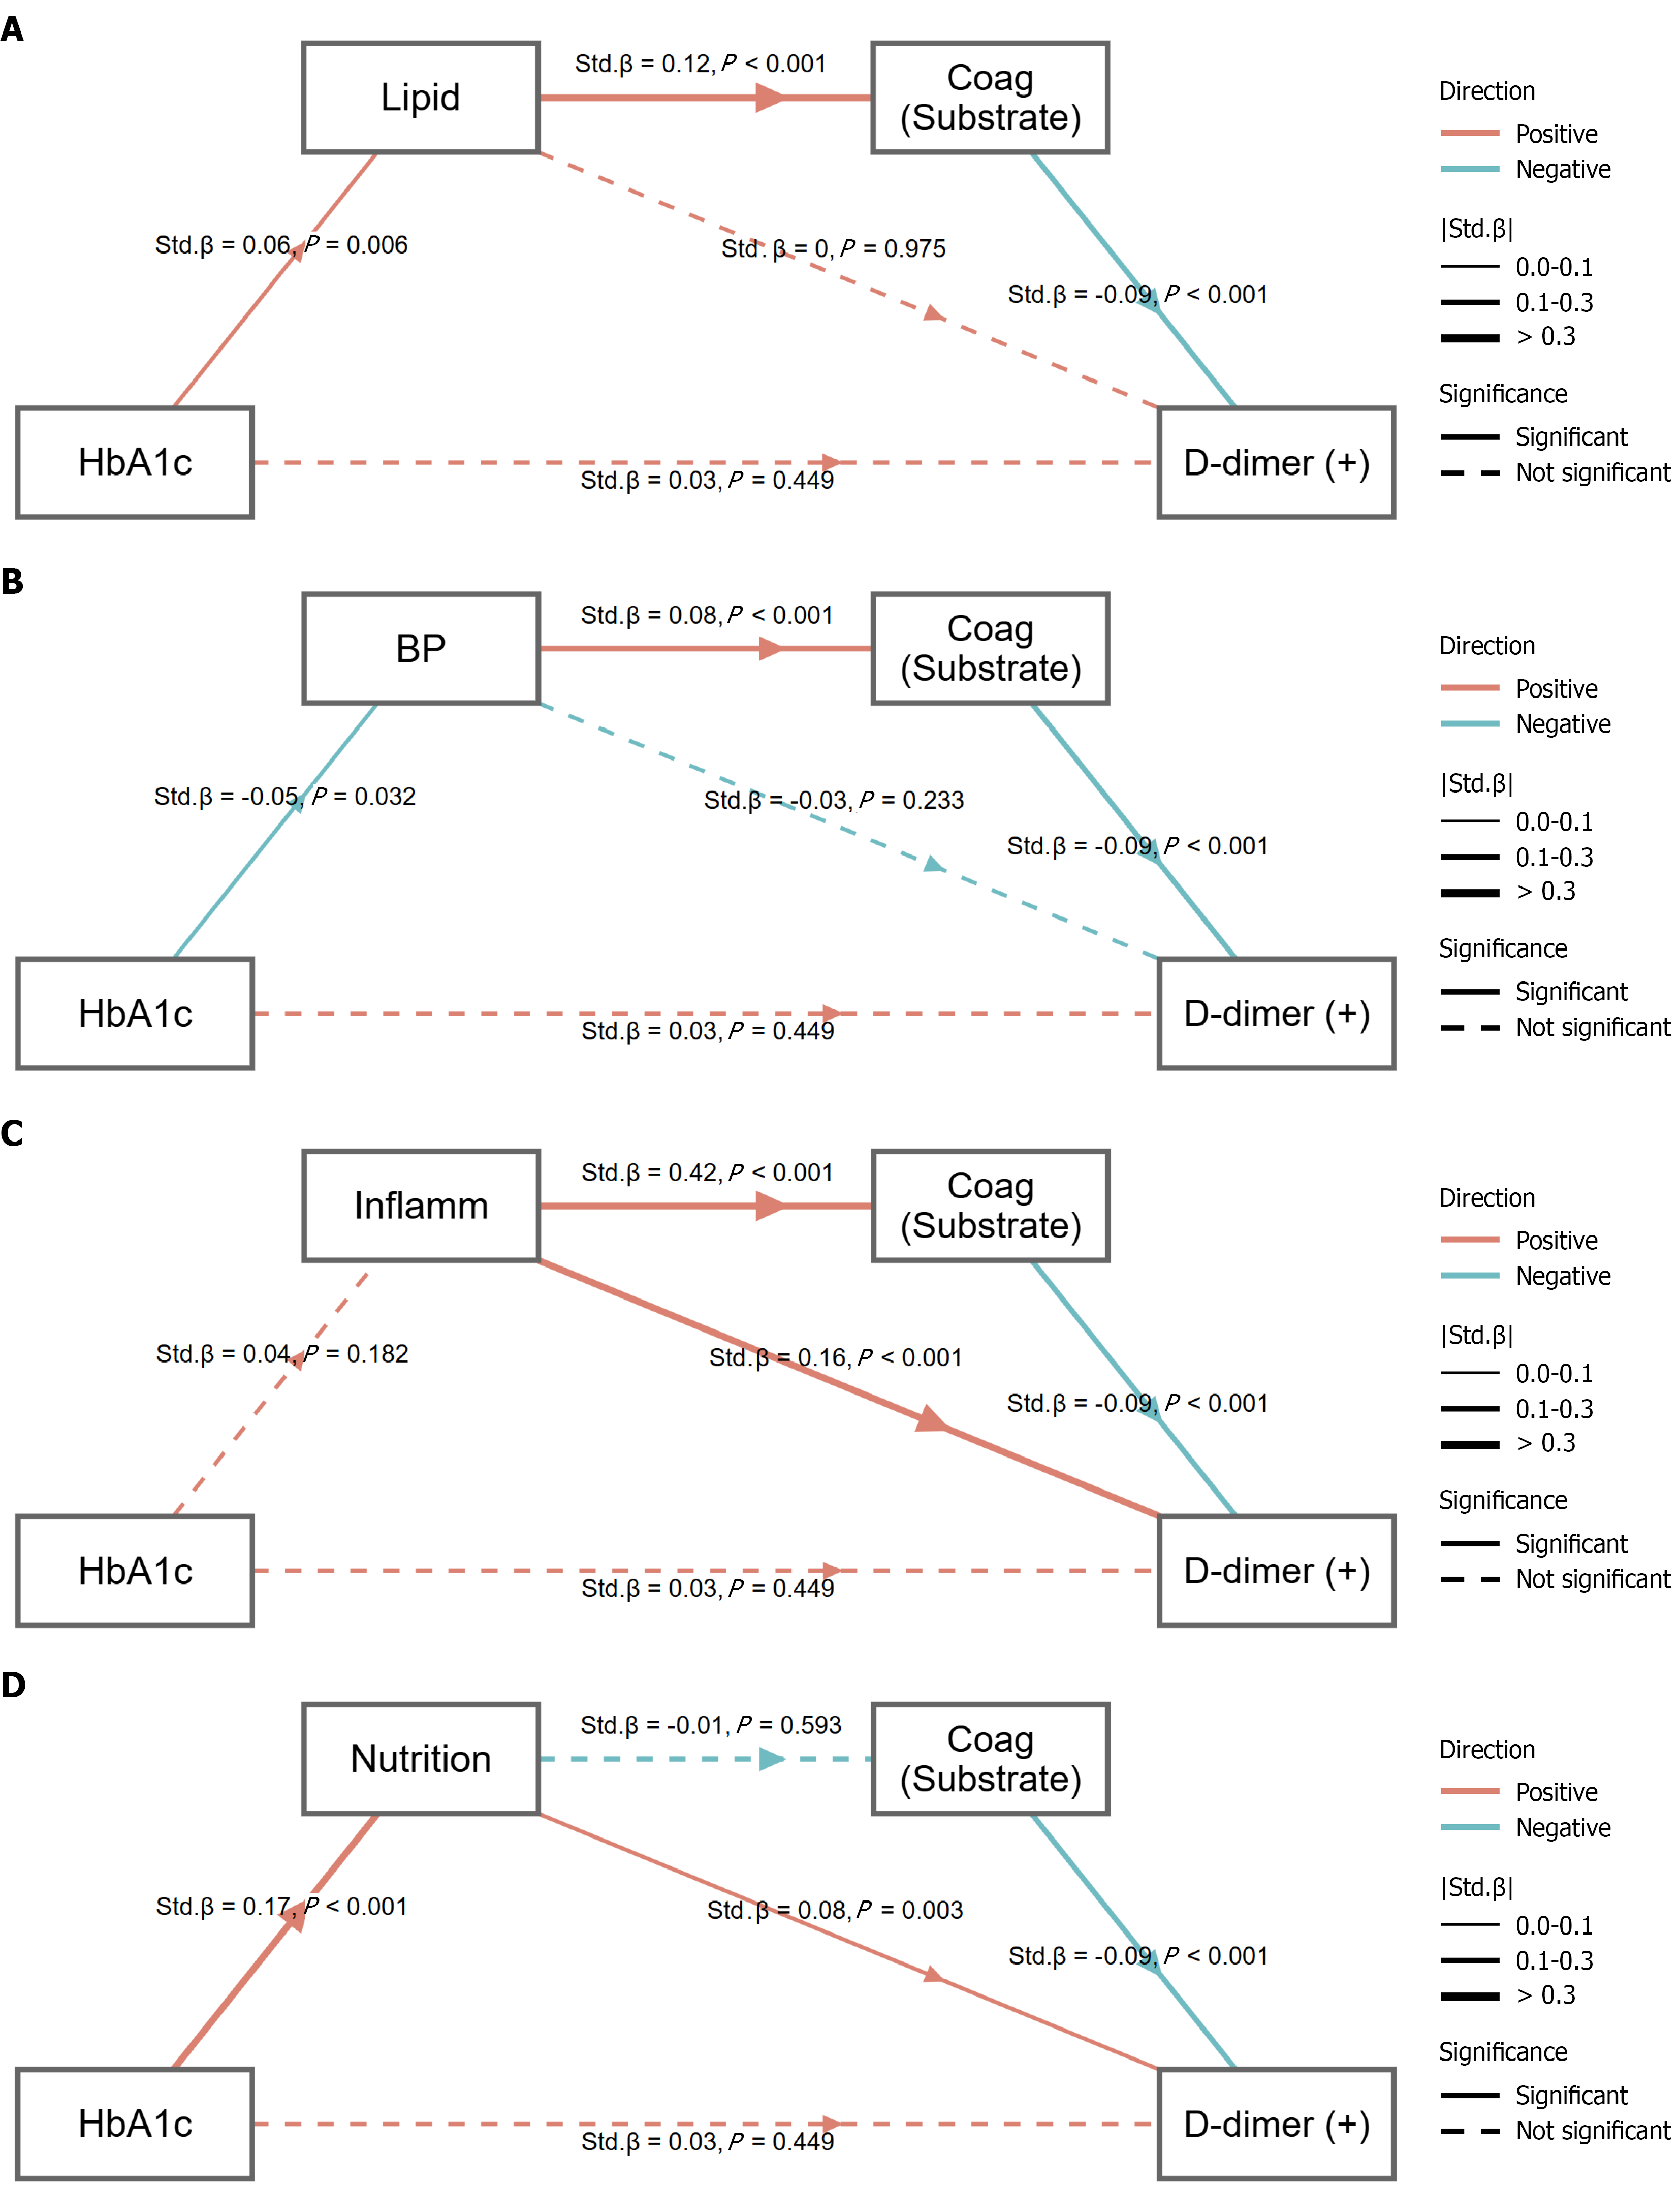
Figure 7 Pathways linking glycated hemoglobin to D-dimer across four upstream pathway domains.
A: Lipid pathway; B: Blood pressure pathway; C: Inflammation pathway; D: Nutrition pathway. A-D present system-specific path diagrams illustrating how glycated hemoglobin relates to D-dimer through upstream physiological pathway indices and a downstream coagulation substrate node. Each panel displays the full set of modeled pathways within the corresponding domain, including the direct association glycated hemoglobin → D-dimer and the indirect pathway glycated hemoglobin → upstream pathway index → coagulation (substrate) → D-dimer. Direct paths from each upstream pathway index to D-dimer are also shown, where specified. Panels correspond to four upstream pathway domains: (A) Lipid metabolism; (B) Blood pressure; (C) Inflammation; and (D) Nutrition. Arrow color denotes the direction of the standardized association (red = positive; cyan = negative), arrow thickness reflects the magnitude of the standardized coefficient (|Std.β|; 0-0.1, 0.1-0.3, > 0.3), and line type indicates statistical significance (solid = significant; dashed = not significant). HbA1c: Glycated hemoglobin; BP: Blood pressure.
- Citation: Wei J, Du HY, He Q, Jia SS, Luo FG, Wang YC. Glycemic indicators influence hypercoagulability via multisystem pathways in psychiatric inpatients: Structural equation modeling. World J Psychiatry 2026; 16(10): 121314
- URL: https://www.wjgnet.com/2220-3206/full/v16/i10/121314.htm
- DOI: https://dx.doi.org/10.5498/wjp.121314