
















Copyright: ©Author(s) 2026.
World J Psychiatry. Oct 19, 2026; 16(10): 121314
Published online Oct 19, 2026. doi: 10.5498/wjp.121314
Published online Oct 19, 2026. doi: 10.5498/wjp.121314
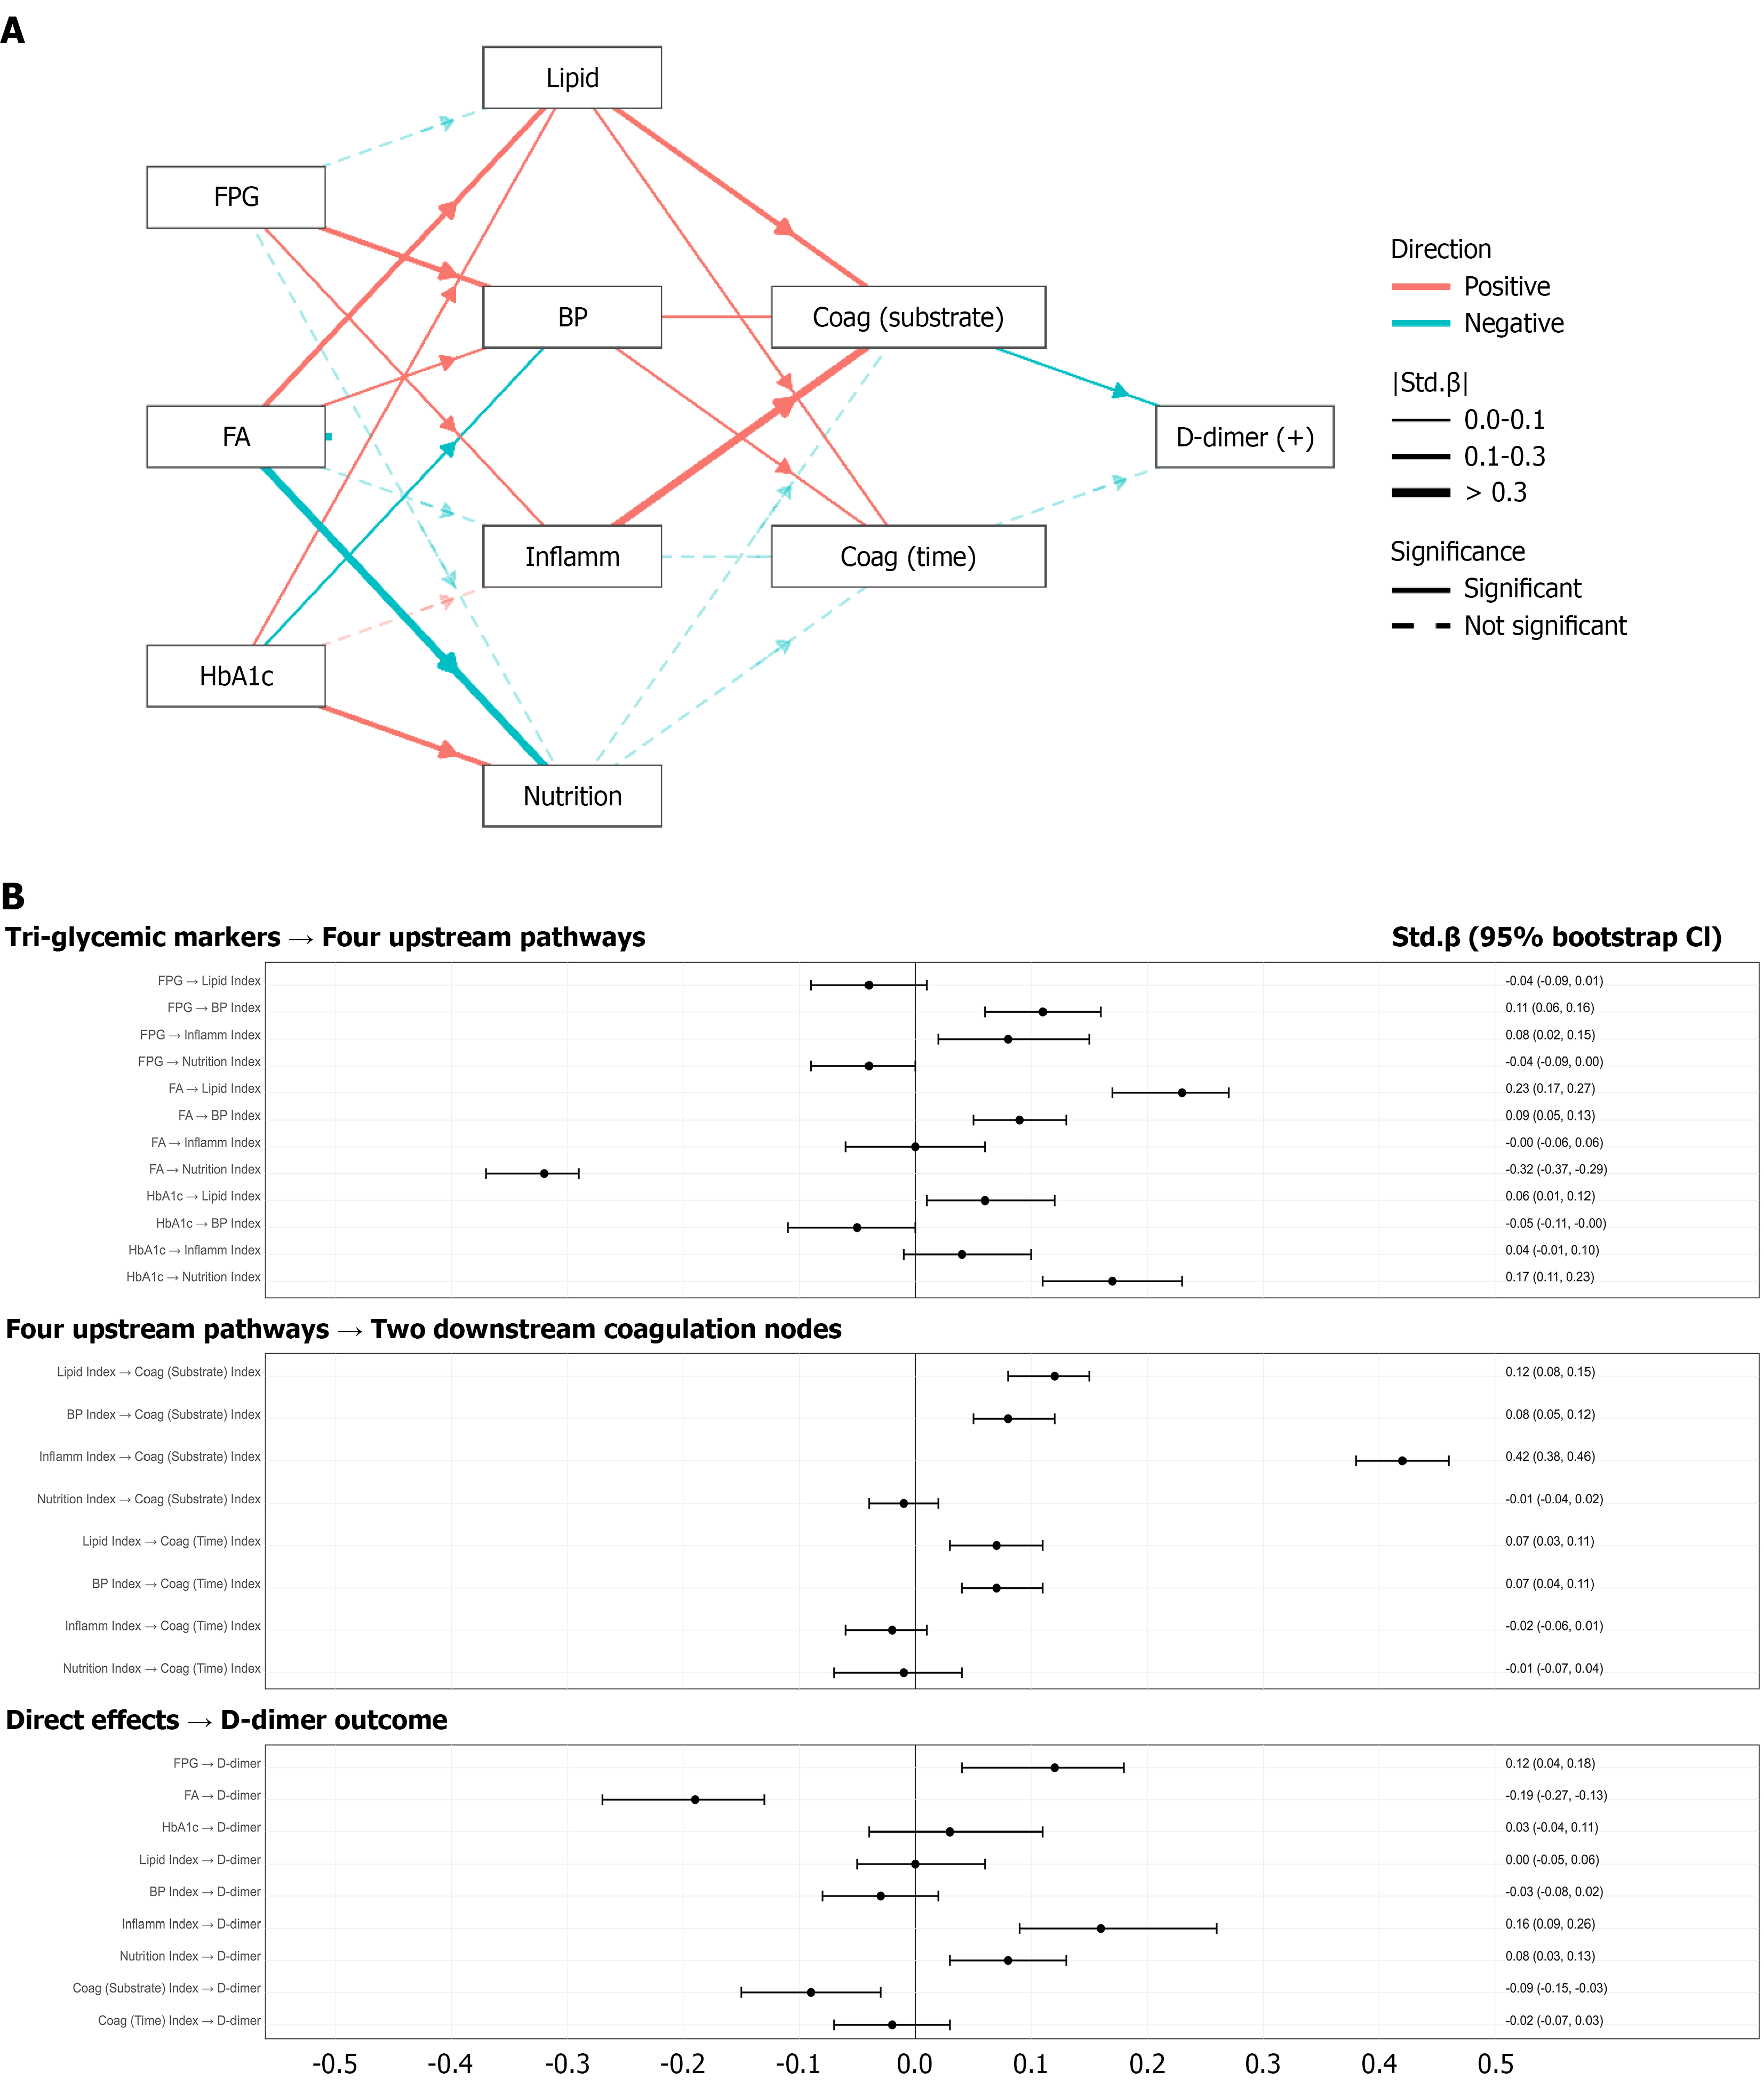
Figure 4 Overview of the main serial structural equation model pathways and standardized bootstrap-estimated effects on D-dimer outcomes.
A: Main serial structural equation modeling pathways; B: Bootstrap-estimated effects. The left (A) depicts the estimated serial structural equation modeling pathways linking three glycemic indicators - fasting plasma glucose, fructosamine, and glycated hemoglobin - to D-dimer outcomes in the main model. Glycemic indicators are modeled to relate to D-dimer through four upstream pathway-level indices (lipid index, blood pressure index, inflammation index, and nutrition index) and two downstream coagulation-related nodes capturing complementary aspects of hemostasis (coagulation substrate index and coagulation time index). Red arrows indicate positive standardized associations and blue arrows indicate negative associations. Solid lines denote statistically significant paths, whereas dashed lines indicate non-significant paths. Line width reflects the magnitude of the standardized coefficient (|Std.β|). Collectively, the structural component explains a non-trivial proportion of variance (R2) in key endogenous nodes: Lipid index = 0.207, blood pressure index = 0.186, inflammation index = 0.084, nutrition index = 0.291, coagulation substrate index = 0.265, coagulation time/function index = 0.048, and D-dimer = 0.184. The right (B) summarizes the corresponding standardized path estimates using forest plots with bootstrap-derived 95% confidence intervals [Std.β (95% confidence interval), 500 bootstrap resamples]. Effects are organized into three sequential layers aligned with the hypothesized serial pathway structure: (1) Glycemic indicators → upstream pathway indices; (2) Upstream pathway indices → downstream coagulation nodes; and (3) Direct effects on D-dimer. Points represent standardized coefficients, horizontal bars indicate bootstrap-derived 95% confidence intervals, and the vertical reference line denotes the null effect (Std.β = 0). Together, these combined visualization provides an integrated overview of the modeled multisystem associations linking glycemic markers, intermediate physiological pathways, and D-dimer outcomes within the main structural equation modeling framework. FA: Fructosamine; FPG: Fasting plasma glucose; HbA1c: Glycated hemoglobin; BP: Blood pressure; CI: Confidence interval.
- Citation: Wei J, Du HY, He Q, Jia SS, Luo FG, Wang YC. Glycemic indicators influence hypercoagulability via multisystem pathways in psychiatric inpatients: Structural equation modeling. World J Psychiatry 2026; 16(10): 121314
- URL: https://www.wjgnet.com/2220-3206/full/v16/i10/121314.htm
- DOI: https://dx.doi.org/10.5498/wjp.121314