
















Copyright: ©Author(s) 2026.
World J Psychiatry. Oct 19, 2026; 16(10): 121314
Published online Oct 19, 2026. doi: 10.5498/wjp.121314
Published online Oct 19, 2026. doi: 10.5498/wjp.121314
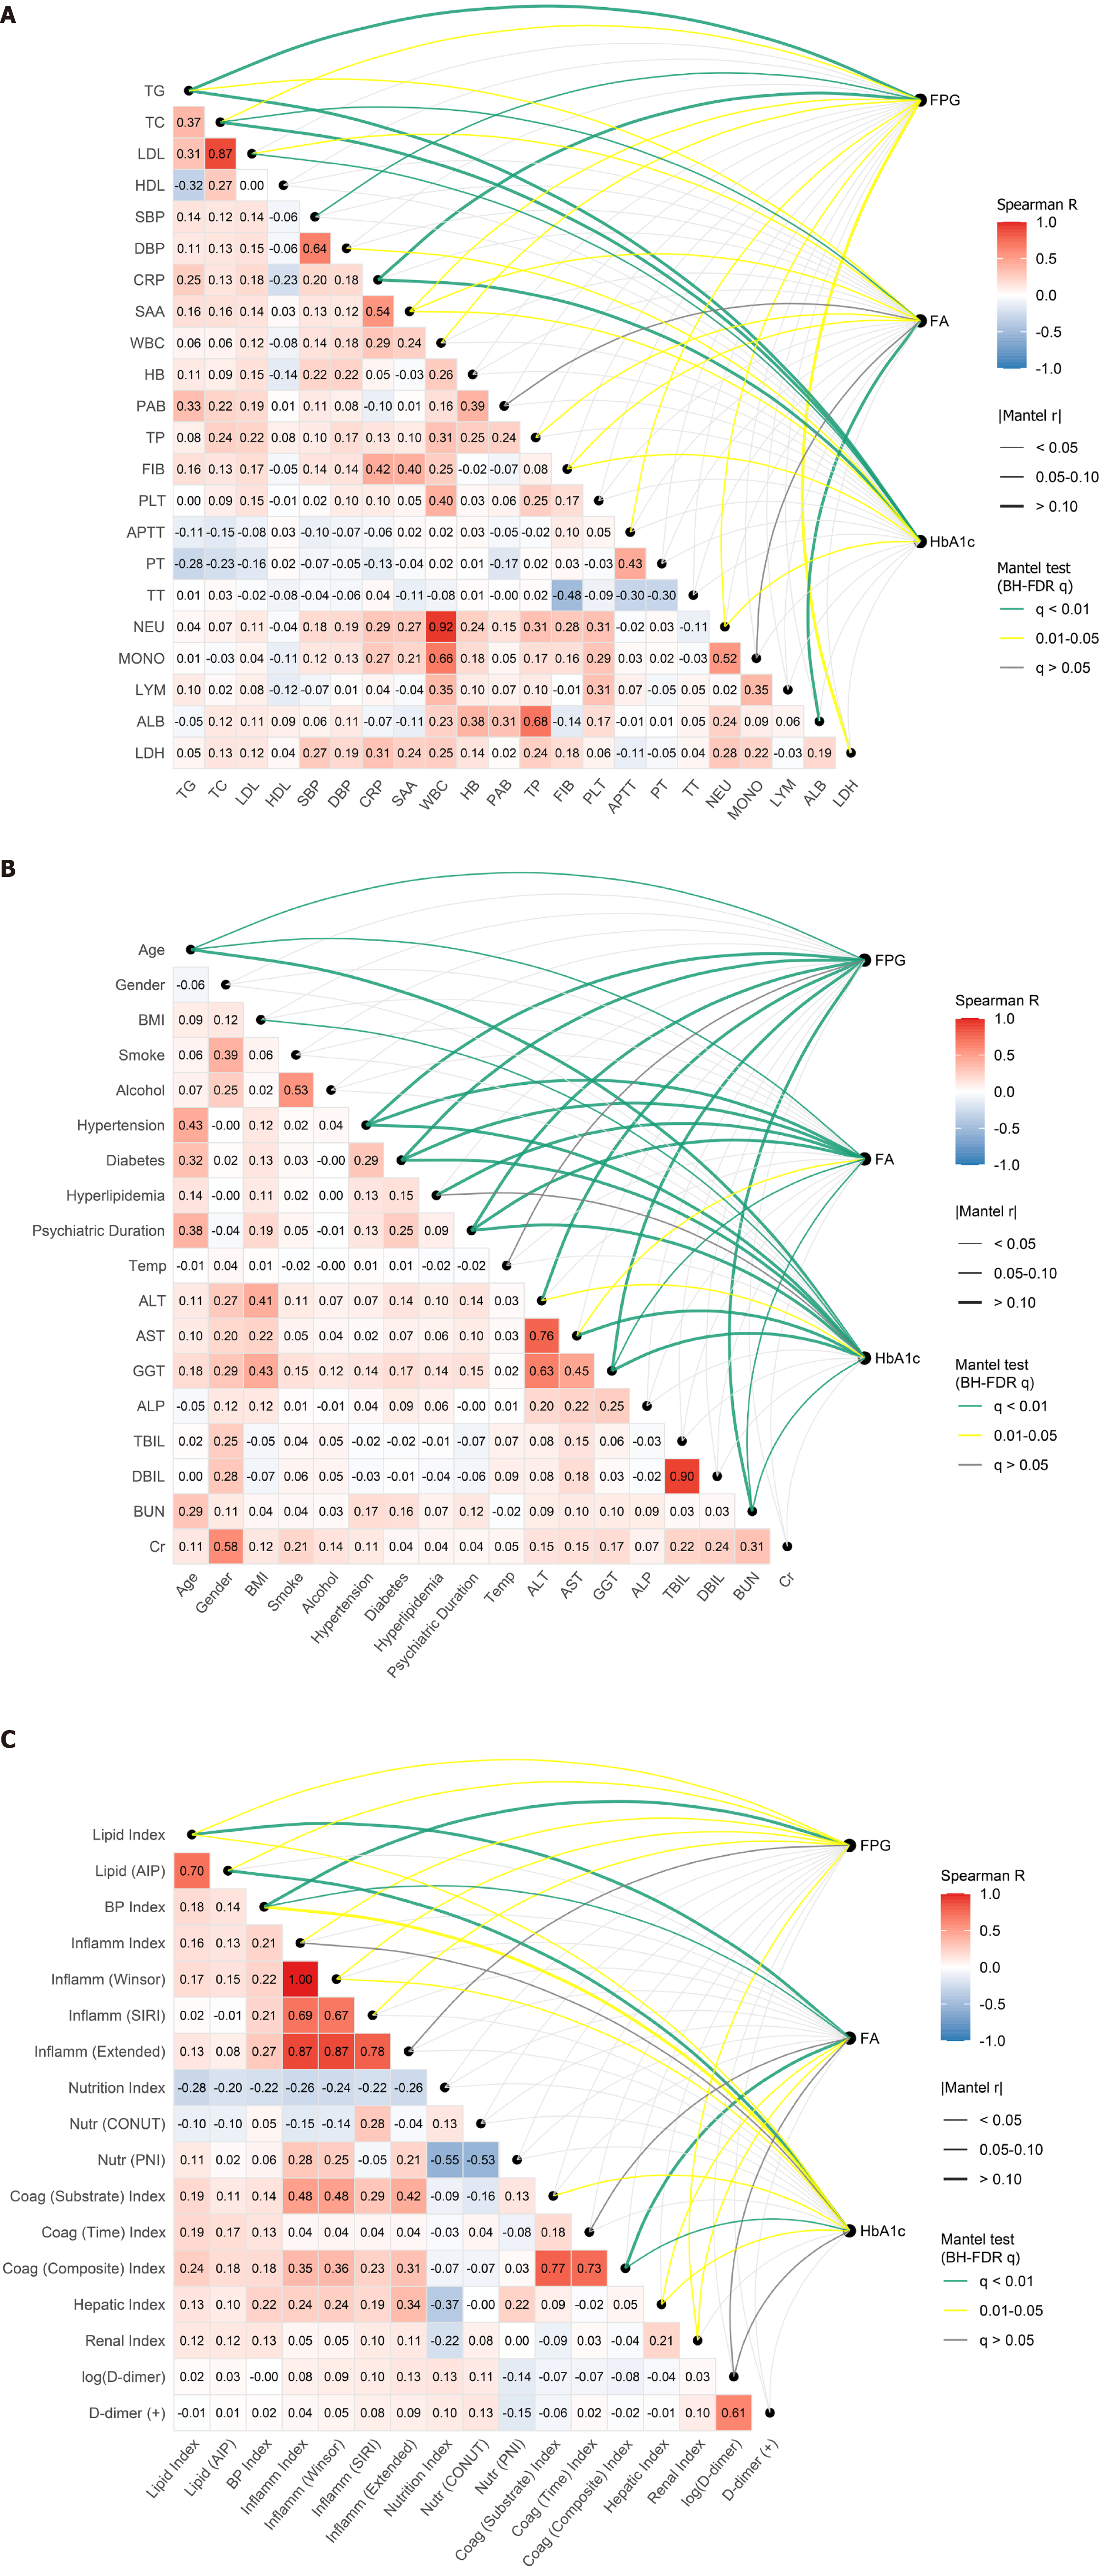
Figure 3 Associations between glycemic markers and multisystem pathway features in the overall cohort and diagnostic subgroups of psychiatric inpatients.
A: Laboratory biomarkers; B: Covariate features; C: Pathway-level indices. A-C summarize the relationships between three glycemic indicators - fasting plasma glucose, fructosamine, and glycated hemoglobin - and multilevel biological features spanning metabolic, cardiovascular, inflammatory, nutritional, and coagulation domains. In each panel, lower-triangle heatmaps display pairwise Spearman correlation coefficients among observed variables or composite pathway indices (red indicates positive correlations and blue indicates negative correlations, with numeric coefficients shown in each cell). Curved links on the right represent associations between each glycemic marker and the corresponding feature matrix assessed using Mantel tests (maximum matrix size constrained to n = 300 and significance evaluated using 999 permutations). Line thickness reflects the absolute Mantel correlation coefficient (|r|), and link color denotes statistical significance after Benjamini-Hochberg false discovery rate correction: Green, q < 0.01; yellow, q = 0.01-0.05; grey, q ≥ 0.05. A focuses on laboratory biomarkers constituting the composite pathway indices or their sensitivity-analysis components, including markers related to lipid metabolism, blood pressure, inflammation, nutritional status, and coagulation function. B presents correlations with covariate features incorporated in the structural models, including demographic characteristics, lifestyle factors, clinical comorbidities, psychiatric illness duration, body temperature status, and hepatic and renal function indicators. C visualizes pathway-level composite indices aligned with the structural modeling framework, including lipid, blood pressure, inflammatory, nutritional, hepatic, renal, and coagulation pathway constructs, together with downstream coagulation dimensions - coagulation substrate and coagulation time/function - as well as D-dimer outcomes. Visually, the heatmaps show clustered correlation patterns within biologically related domains, with relatively stronger intra-domain correlations among laboratory biomarkers (A) and more heterogeneous correlation structures among covariate features (B) and pathway-level composite indices (C).
- Citation: Wei J, Du HY, He Q, Jia SS, Luo FG, Wang YC. Glycemic indicators influence hypercoagulability via multisystem pathways in psychiatric inpatients: Structural equation modeling. World J Psychiatry 2026; 16(10): 121314
- URL: https://www.wjgnet.com/2220-3206/full/v16/i10/121314.htm
- DOI: https://dx.doi.org/10.5498/wjp.121314