
















Copyright: ©Author(s) 2026.
World J Psychiatry. Oct 19, 2026; 16(10): 120072
Published online Oct 19, 2026. doi: 10.5498/wjp.120072
Published online Oct 19, 2026. doi: 10.5498/wjp.120072
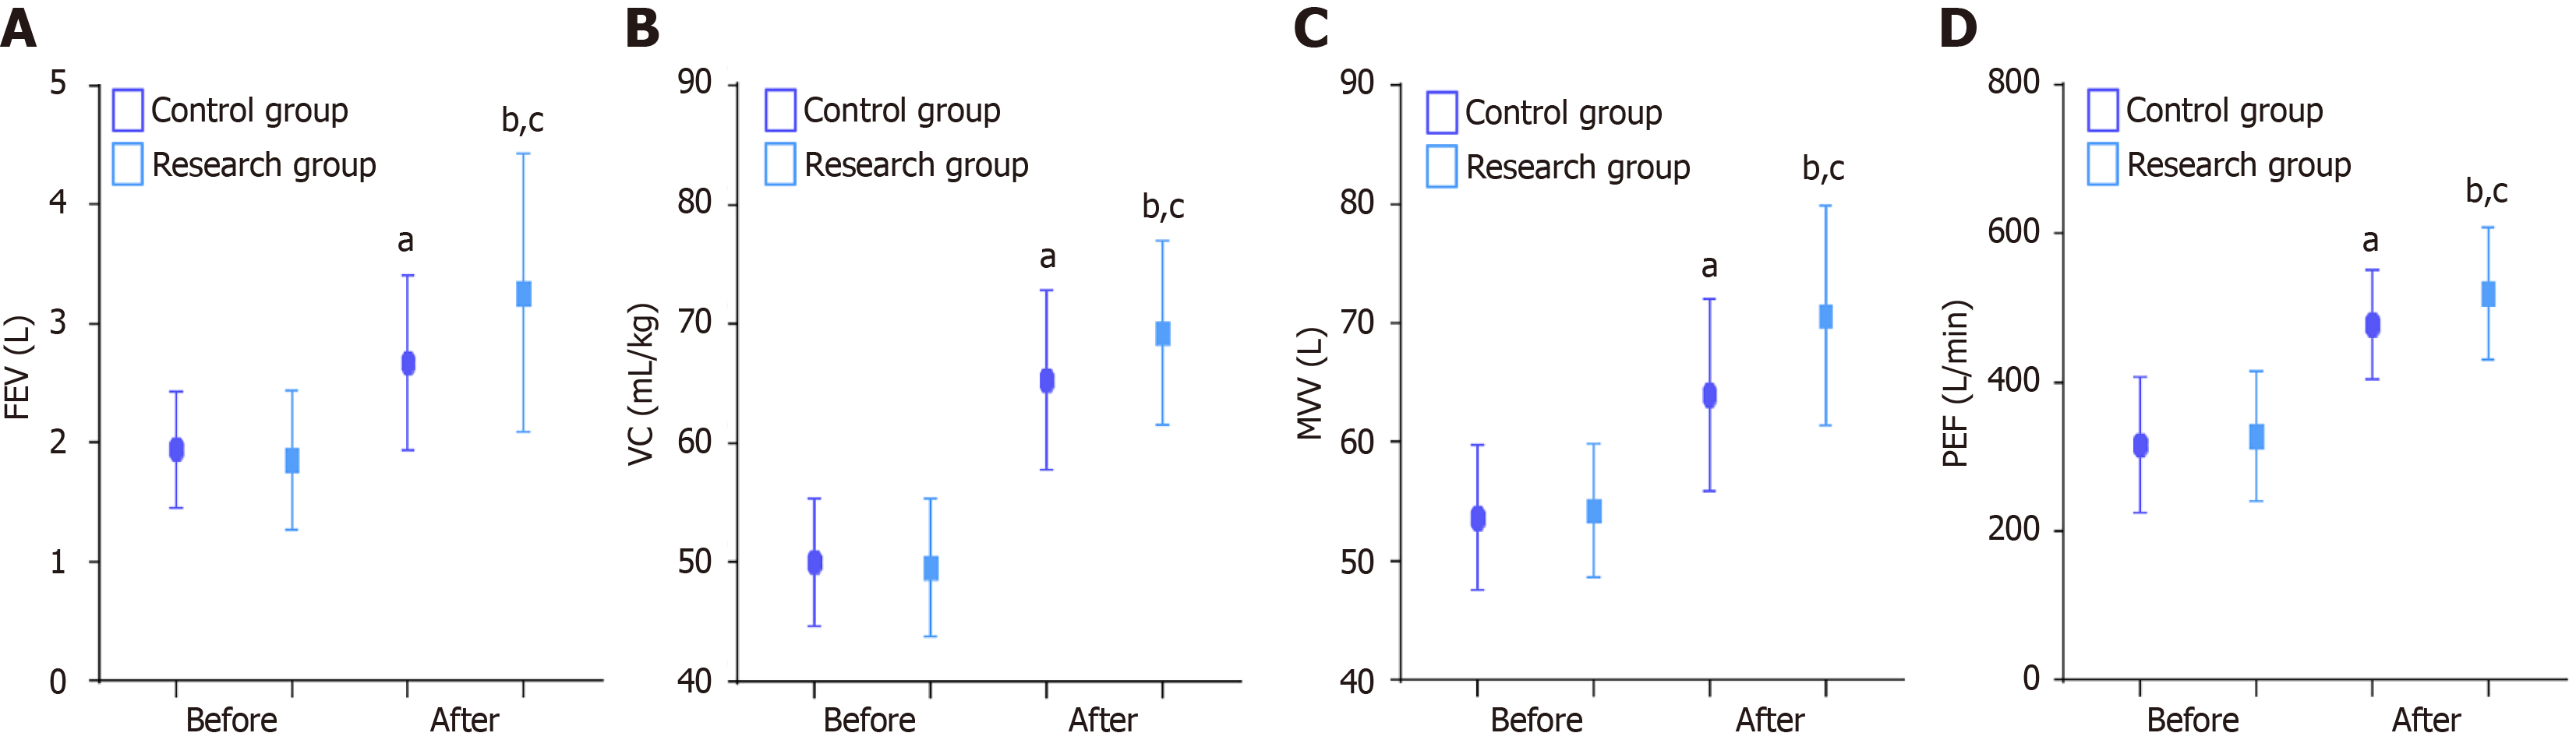
Figure 4 Comparative pulmonary function evaluation.
A: Forced expiratory volume levels across the research and control groups; B: Vital capacity levels across groups; C: Maximal voluntary ventilation levels in both cohorts; D: Peak expiratory flow levels across the research and control groups. aP < 0.05, bP < 0.01 vs baseline; cP < 0.05 vs control. FEV: Forced expiratory volume; VC: Vital capacity; MVV: Maximal voluntary ventilation; PEF: Peak expiratory flow.
- Citation: Zhang C, Pang JG, Wang MW, Bi D, Fu YX. Therapeutic play-based guidance for children with pneumonia: Impact on treatment compliance, anxiety, and fear. World J Psychiatry 2026; 16(10): 120072
- URL: https://www.wjgnet.com/2220-3206/full/v16/i10/120072.htm
- DOI: https://dx.doi.org/10.5498/wjp.120072