
















Copyright: ©Author(s) 2026.
World J Psychiatry. Oct 19, 2026; 16(10): 118743
Published online Oct 19, 2026. doi: 10.5498/wjp.118743
Published online Oct 19, 2026. doi: 10.5498/wjp.118743
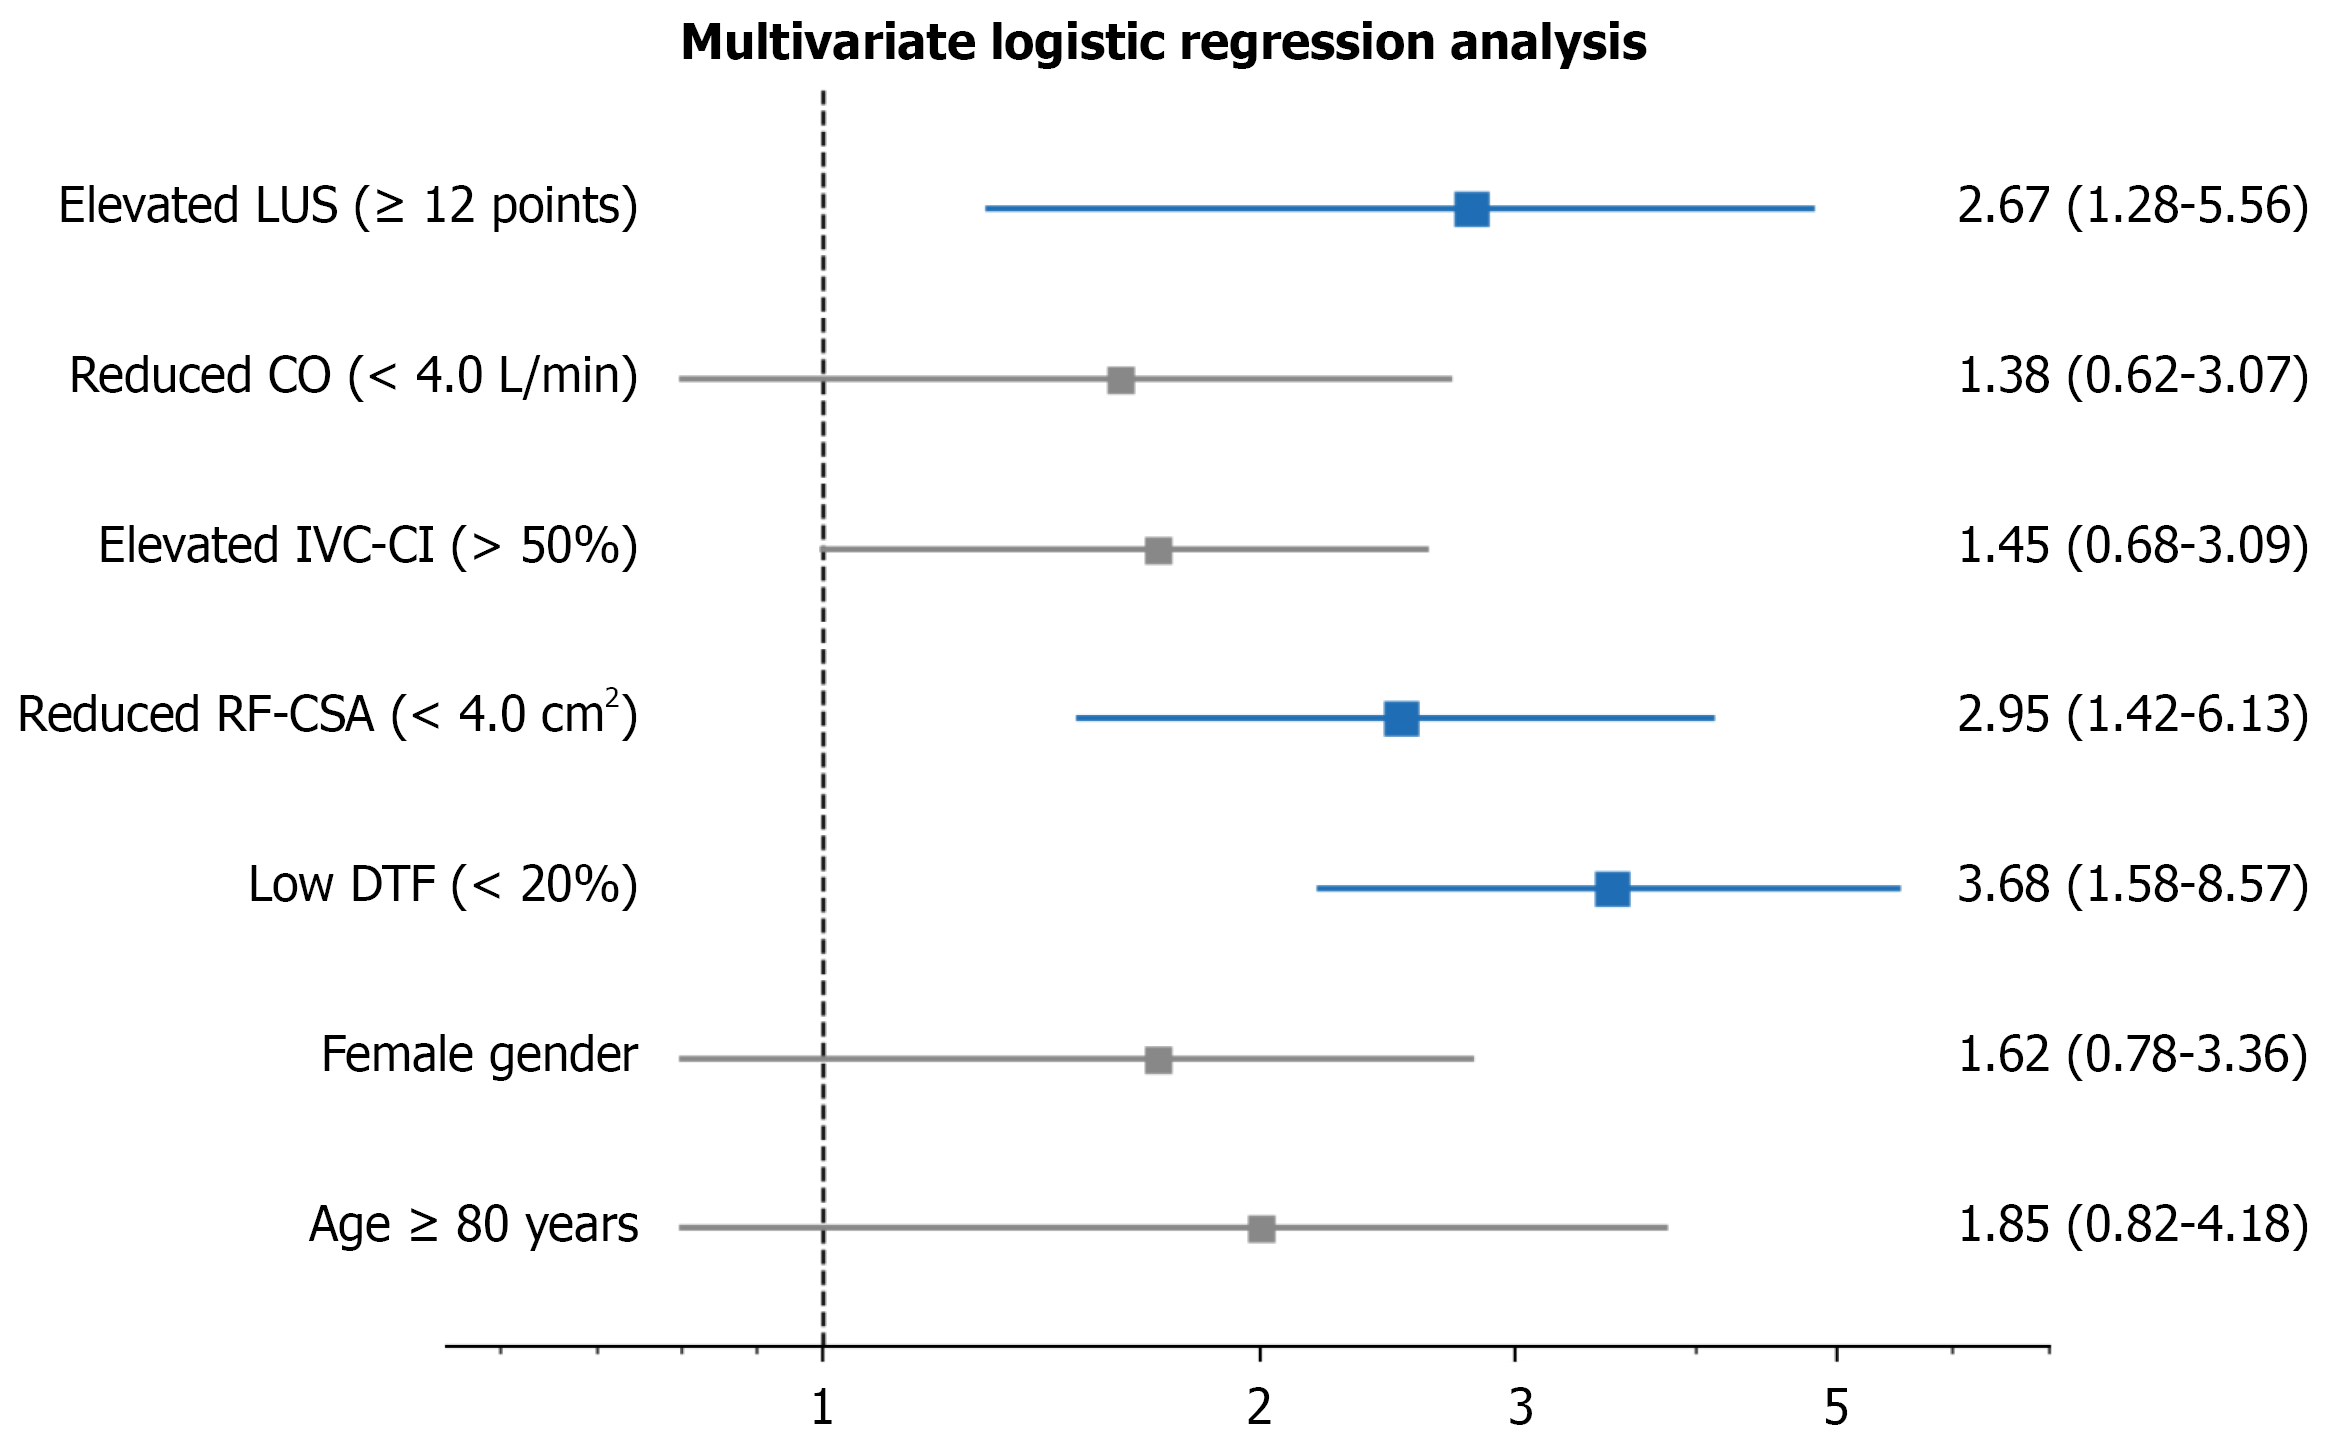
Figure 2 Forest plot of multivariate logistic regression analysis.
Blue squares indicate significant associations (P < 0.05); gray squares indicate non-significant associations. CO: Cardiac output; DTF: Diaphragm thickness fraction; IVC-CI: Inferior vena cava collapsibility index; LUS: Lung ultrasound score; RF-CSA: Rectus femoris cross-sectional area.
- Citation: Wang DY, Fu CH, Ma MM, Men LC, Huang B, Han Y. Risk factors for anxiety and depression in elderly frail patients based on bedside ultrasound multimodal assessment. World J Psychiatry 2026; 16(10): 118743
- URL: https://www.wjgnet.com/2220-3206/full/v16/i10/118743.htm
- DOI: https://dx.doi.org/10.5498/wjp.118743