
















©The Author(s) 2026.
World J Psychiatry. Jan 19, 2026; 16(1): 113130
Published online Jan 19, 2026. doi: 10.5498/wjp.v16.i1.113130
Published online Jan 19, 2026. doi: 10.5498/wjp.v16.i1.113130
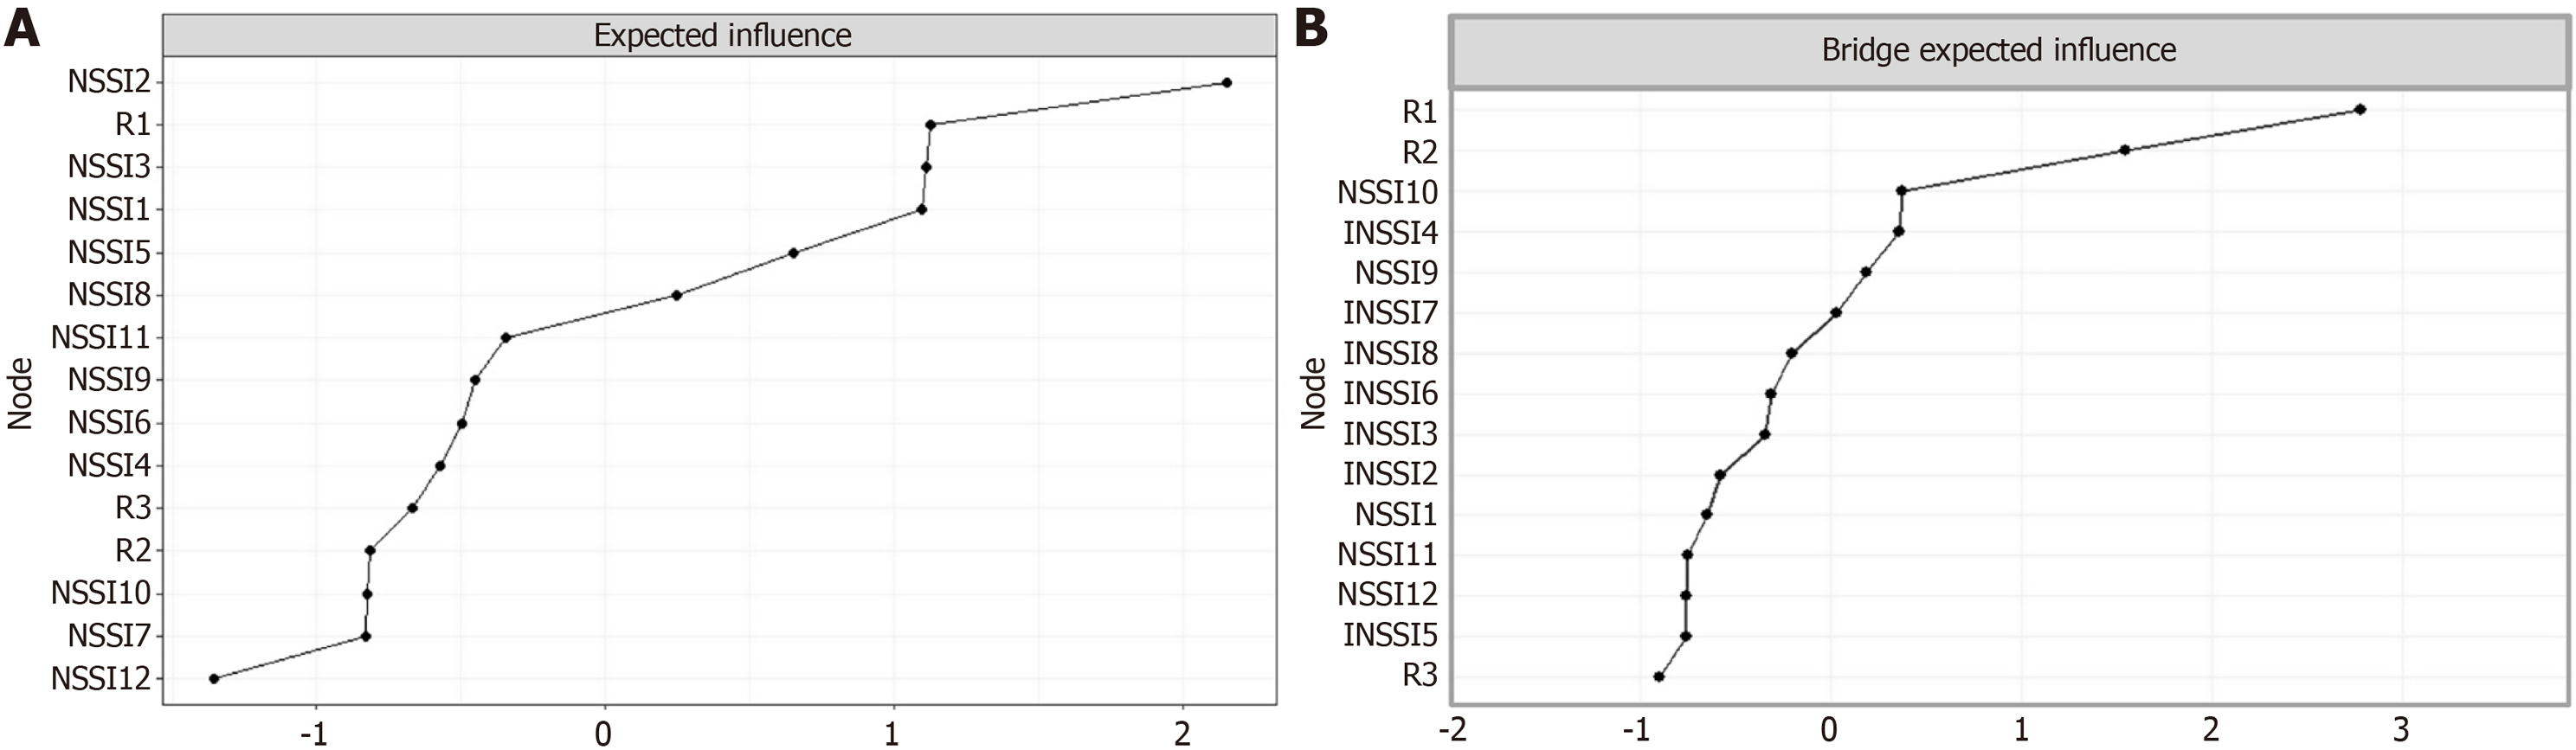
Figure 2 Standardized value (z-score) of expected influence and bridge expected influence for each node in the network.
A: Each point represents a symptom [rumination subtype or non-suicidal self-injury (NSSI) behavior]. The vertical axis shows the standardized expected influence (z-score) of each symptom, indicating how strongly it is connected to other symptoms in the network. Higher points correspond to more central symptoms with greater influence. The lines connecting points are for visualization purposes only and do not imply causal relationships; B: Each point represents a symptom (rumination subtype or NSSI behavior). The vertical axis shows the standardized bridge expected influence (z-score), indicating how strongly a symptom links different symptom clusters (e.g., cognitive and behavioral symptoms). Higher points indicate symptoms that act as bridges between networks. The lines connecting points are for visualization only and do not imply causal relationships. NSSI: Non-suicidal self-injury.
- Citation: Zhang FF, Guo R, Chen SL, Yang W, Liang XL, Ma MF. Network perspective on rumination and non-suicidal self-injury among adolescents with depressive disorders. World J Psychiatry 2026; 16(1): 113130
- URL: https://www.wjgnet.com/2220-3206/full/v16/i1/113130.htm
- DOI: https://dx.doi.org/10.5498/wjp.v16.i1.113130