Copyright
©The Author(s) 2025.
World J Psychiatry. Sep 19, 2025; 15(9): 109858
Published online Sep 19, 2025. doi: 10.5498/wjp.v15.i9.109858
Published online Sep 19, 2025. doi: 10.5498/wjp.v15.i9.109858
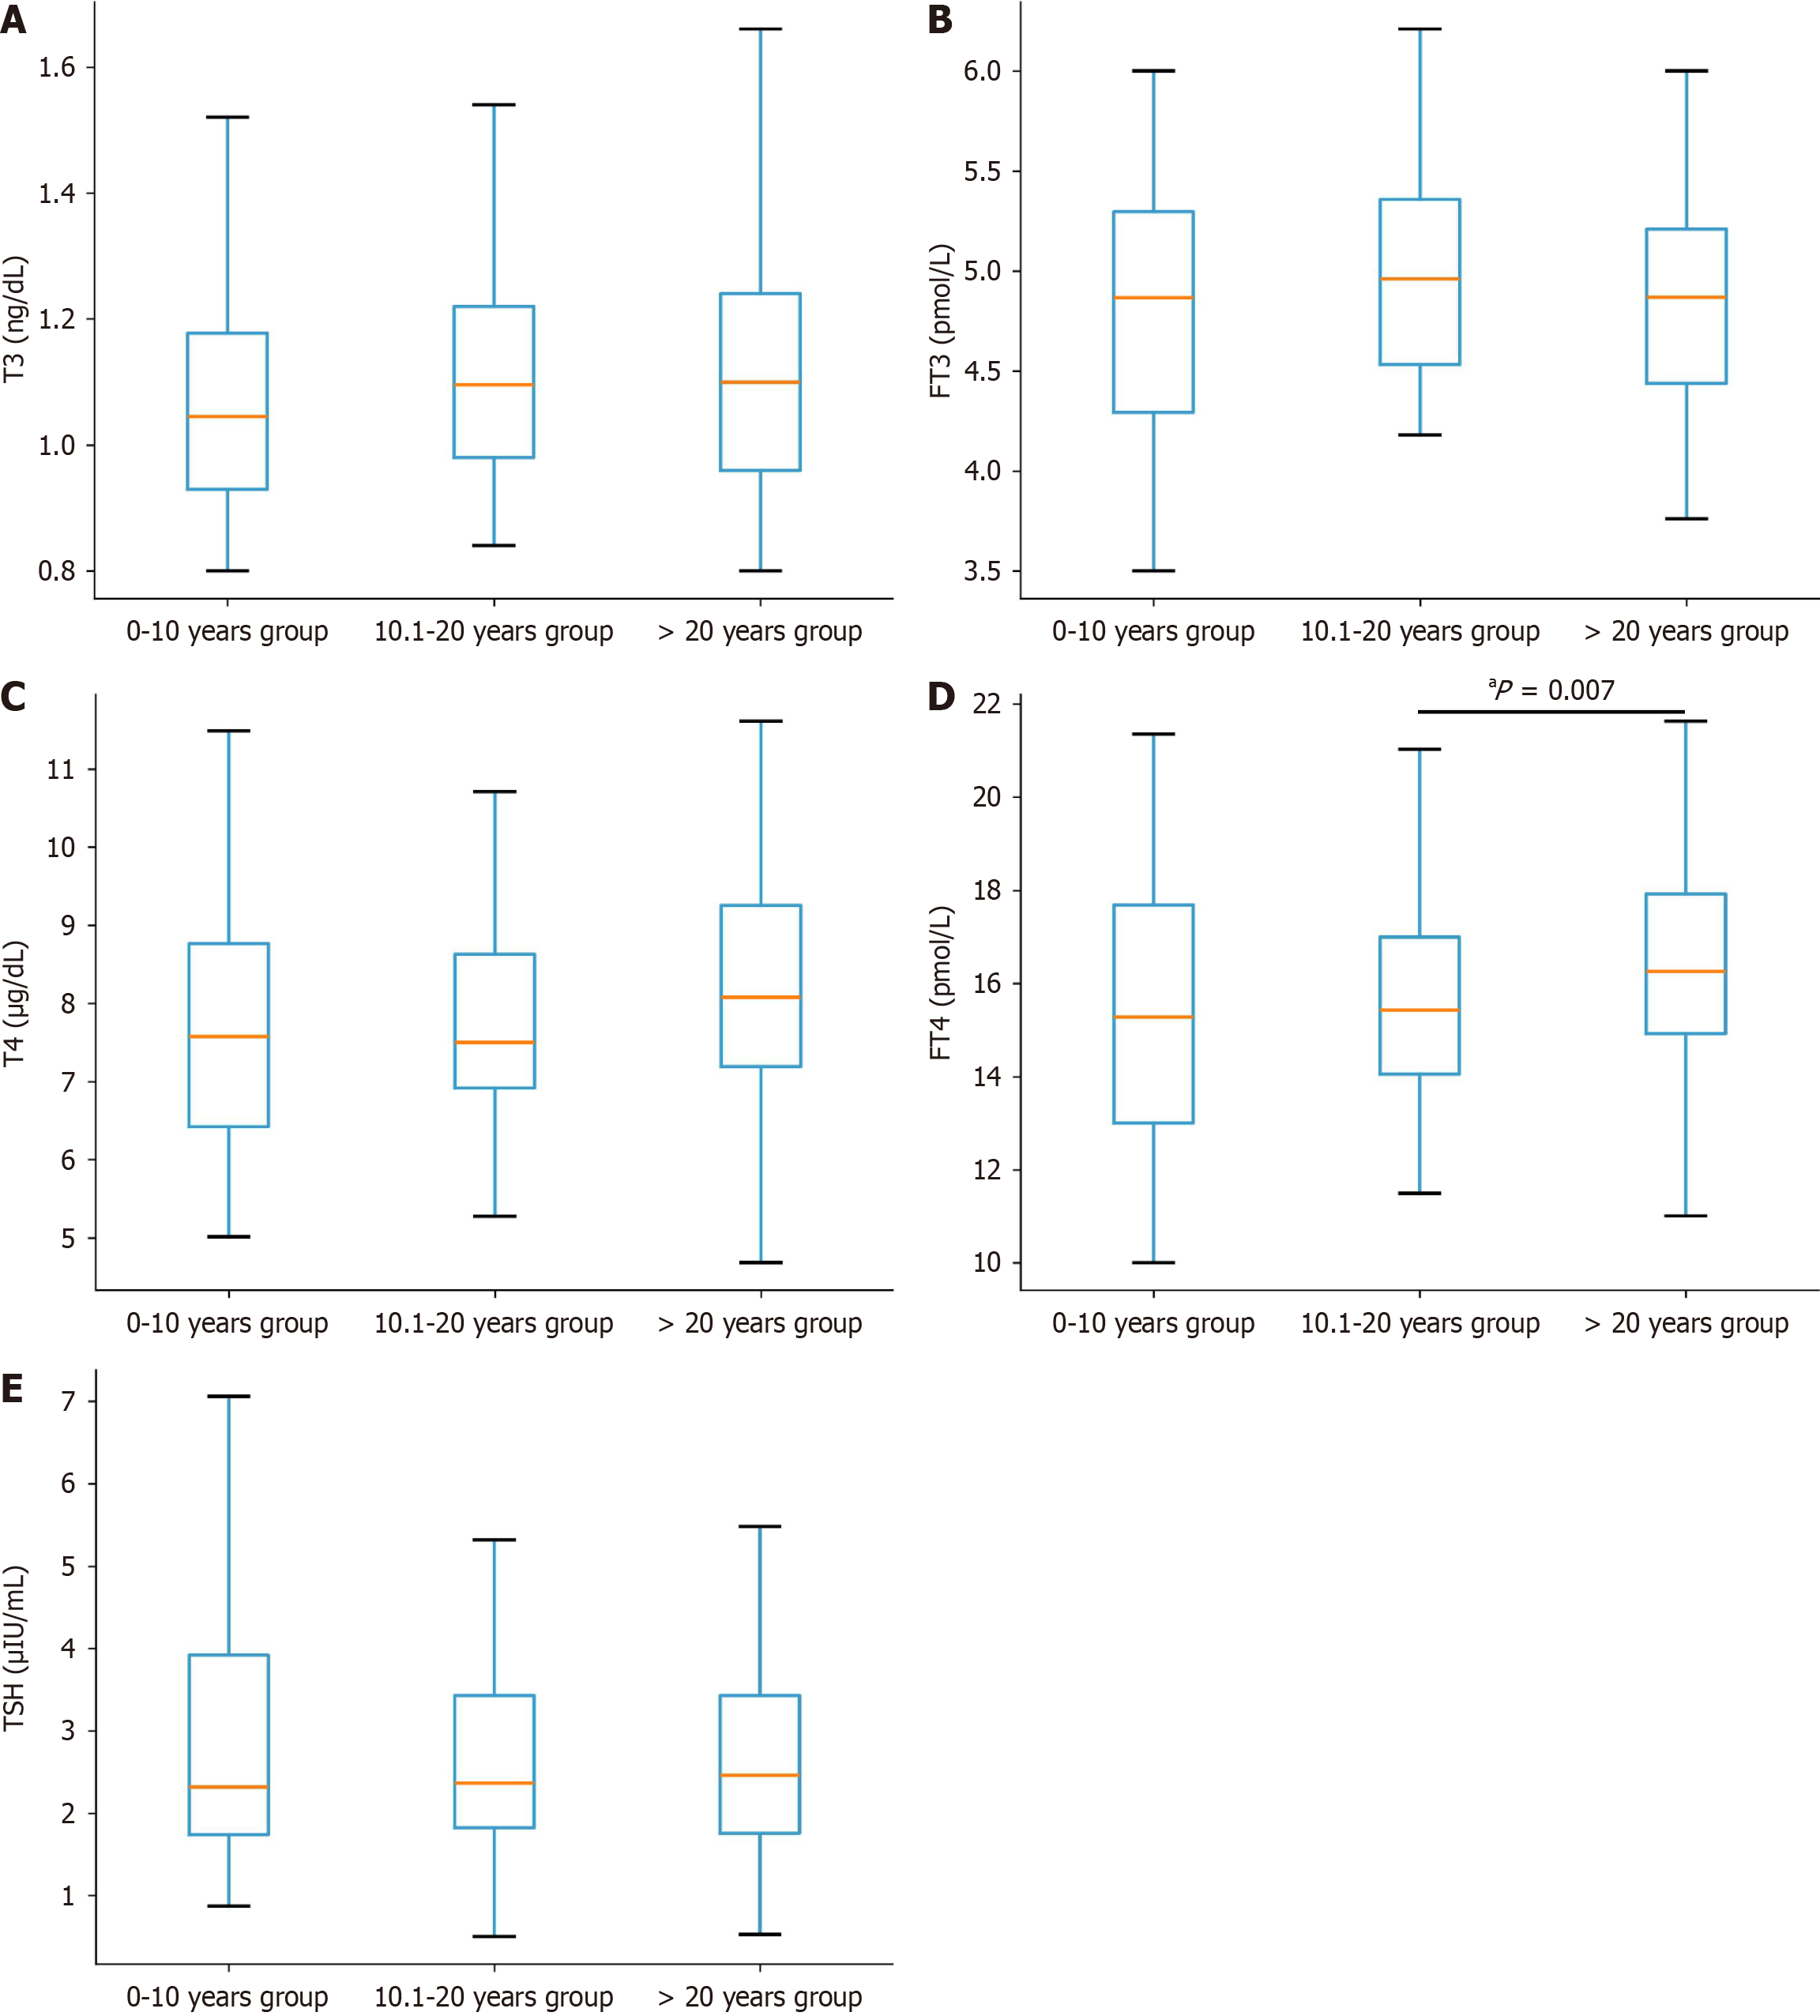
Figure 1 Box plots of intergroup comparisons of thyroid hormone concentrations between groups with different disease duration.
aP < 0.017. A: Triiodothyronine concentrations; B: Free triiodothyronine concentrations; C: Thyroxine concentrations; D: Free thyroxine concentrations; E: Thyroid stimulating hormone concentrations, each compared across the three groups. TSH: Thyroid stimulating hormone; T3: Triiodothyronine; FT3: Free triiodothyronine; T4: Thyroxine; FT4: Free thyroxine.
- Citation: Lei XP, Liao DX, Wu GY, Shuai D, Zhang HL, Wang BY, Wang YL. Disease duration-stratified associations of thyroid hormone levels with psychopathology in hospitalized patients with schizophrenia: A cross-sectional study. World J Psychiatry 2025; 15(9): 109858
- URL: https://www.wjgnet.com/2220-3206/full/v15/i9/109858.htm
- DOI: https://dx.doi.org/10.5498/wjp.v15.i9.109858


