
















©The Author(s) 2025.
World J Psychiatry. Aug 19, 2025; 15(8): 106622
Published online Aug 19, 2025. doi: 10.5498/wjp.v15.i8.106622
Published online Aug 19, 2025. doi: 10.5498/wjp.v15.i8.106622
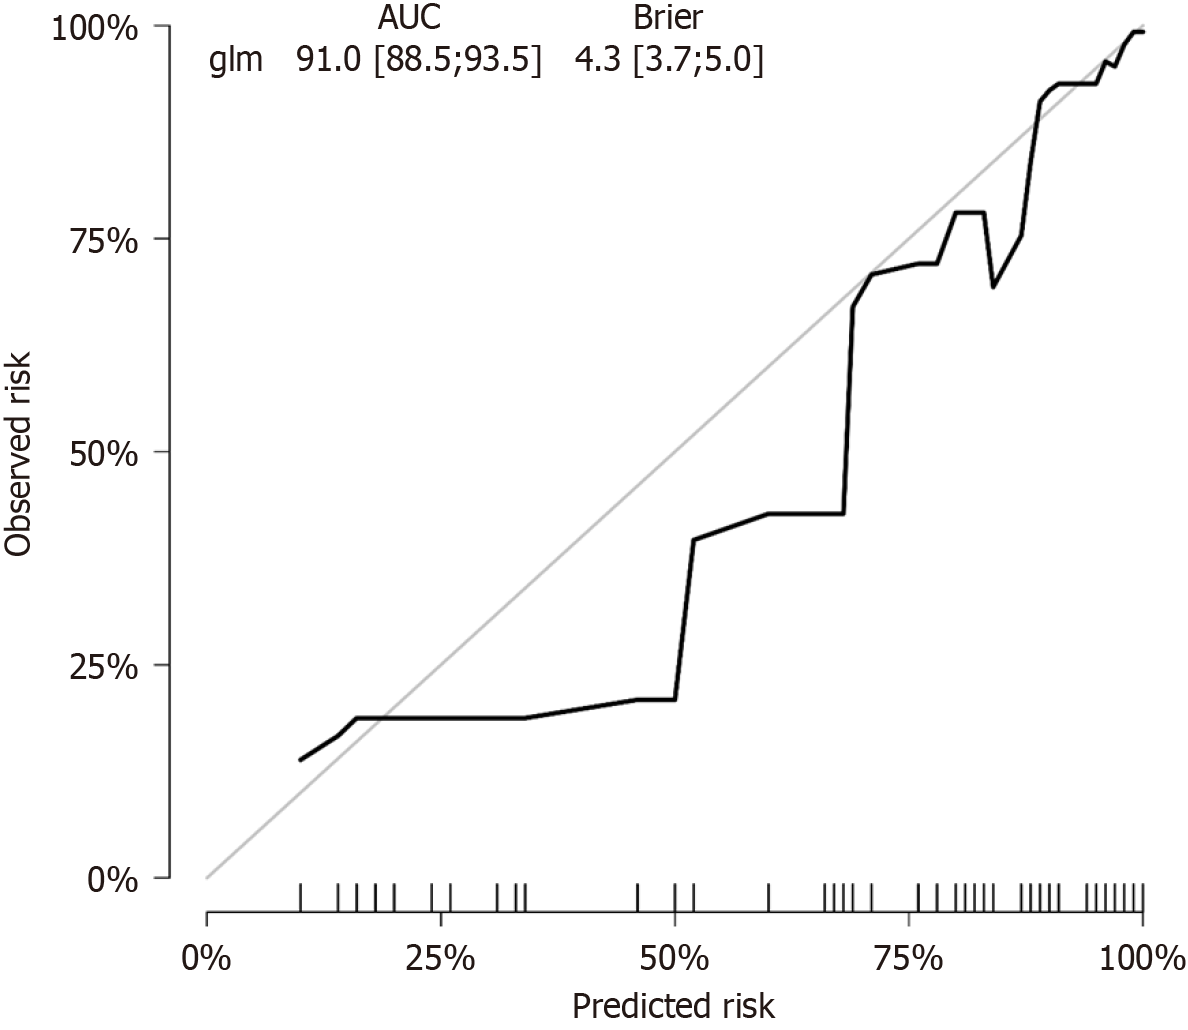
Figure 8 Calibration plot for the logistic regression model.
The plot shows the relationship between predicted and observed risks. AUC: Area under the curve.
- Citation: Chen JM, Rao M, Wei YT, Zhou QG, Tao JL, Wang SB, Bi B. Machine learning-based nomogram for predicting depressive symptoms in women: A cross-sectional study in Guangdong Province, China. World J Psychiatry 2025; 15(8): 106622
- URL: https://www.wjgnet.com/2220-3206/full/v15/i8/106622.htm
- DOI: https://dx.doi.org/10.5498/wjp.v15.i8.106622