Copyright
©The Author(s) 2025.
World J Psychiatry. Jul 19, 2025; 15(7): 107524
Published online Jul 19, 2025. doi: 10.5498/wjp.v15.i7.107524
Published online Jul 19, 2025. doi: 10.5498/wjp.v15.i7.107524
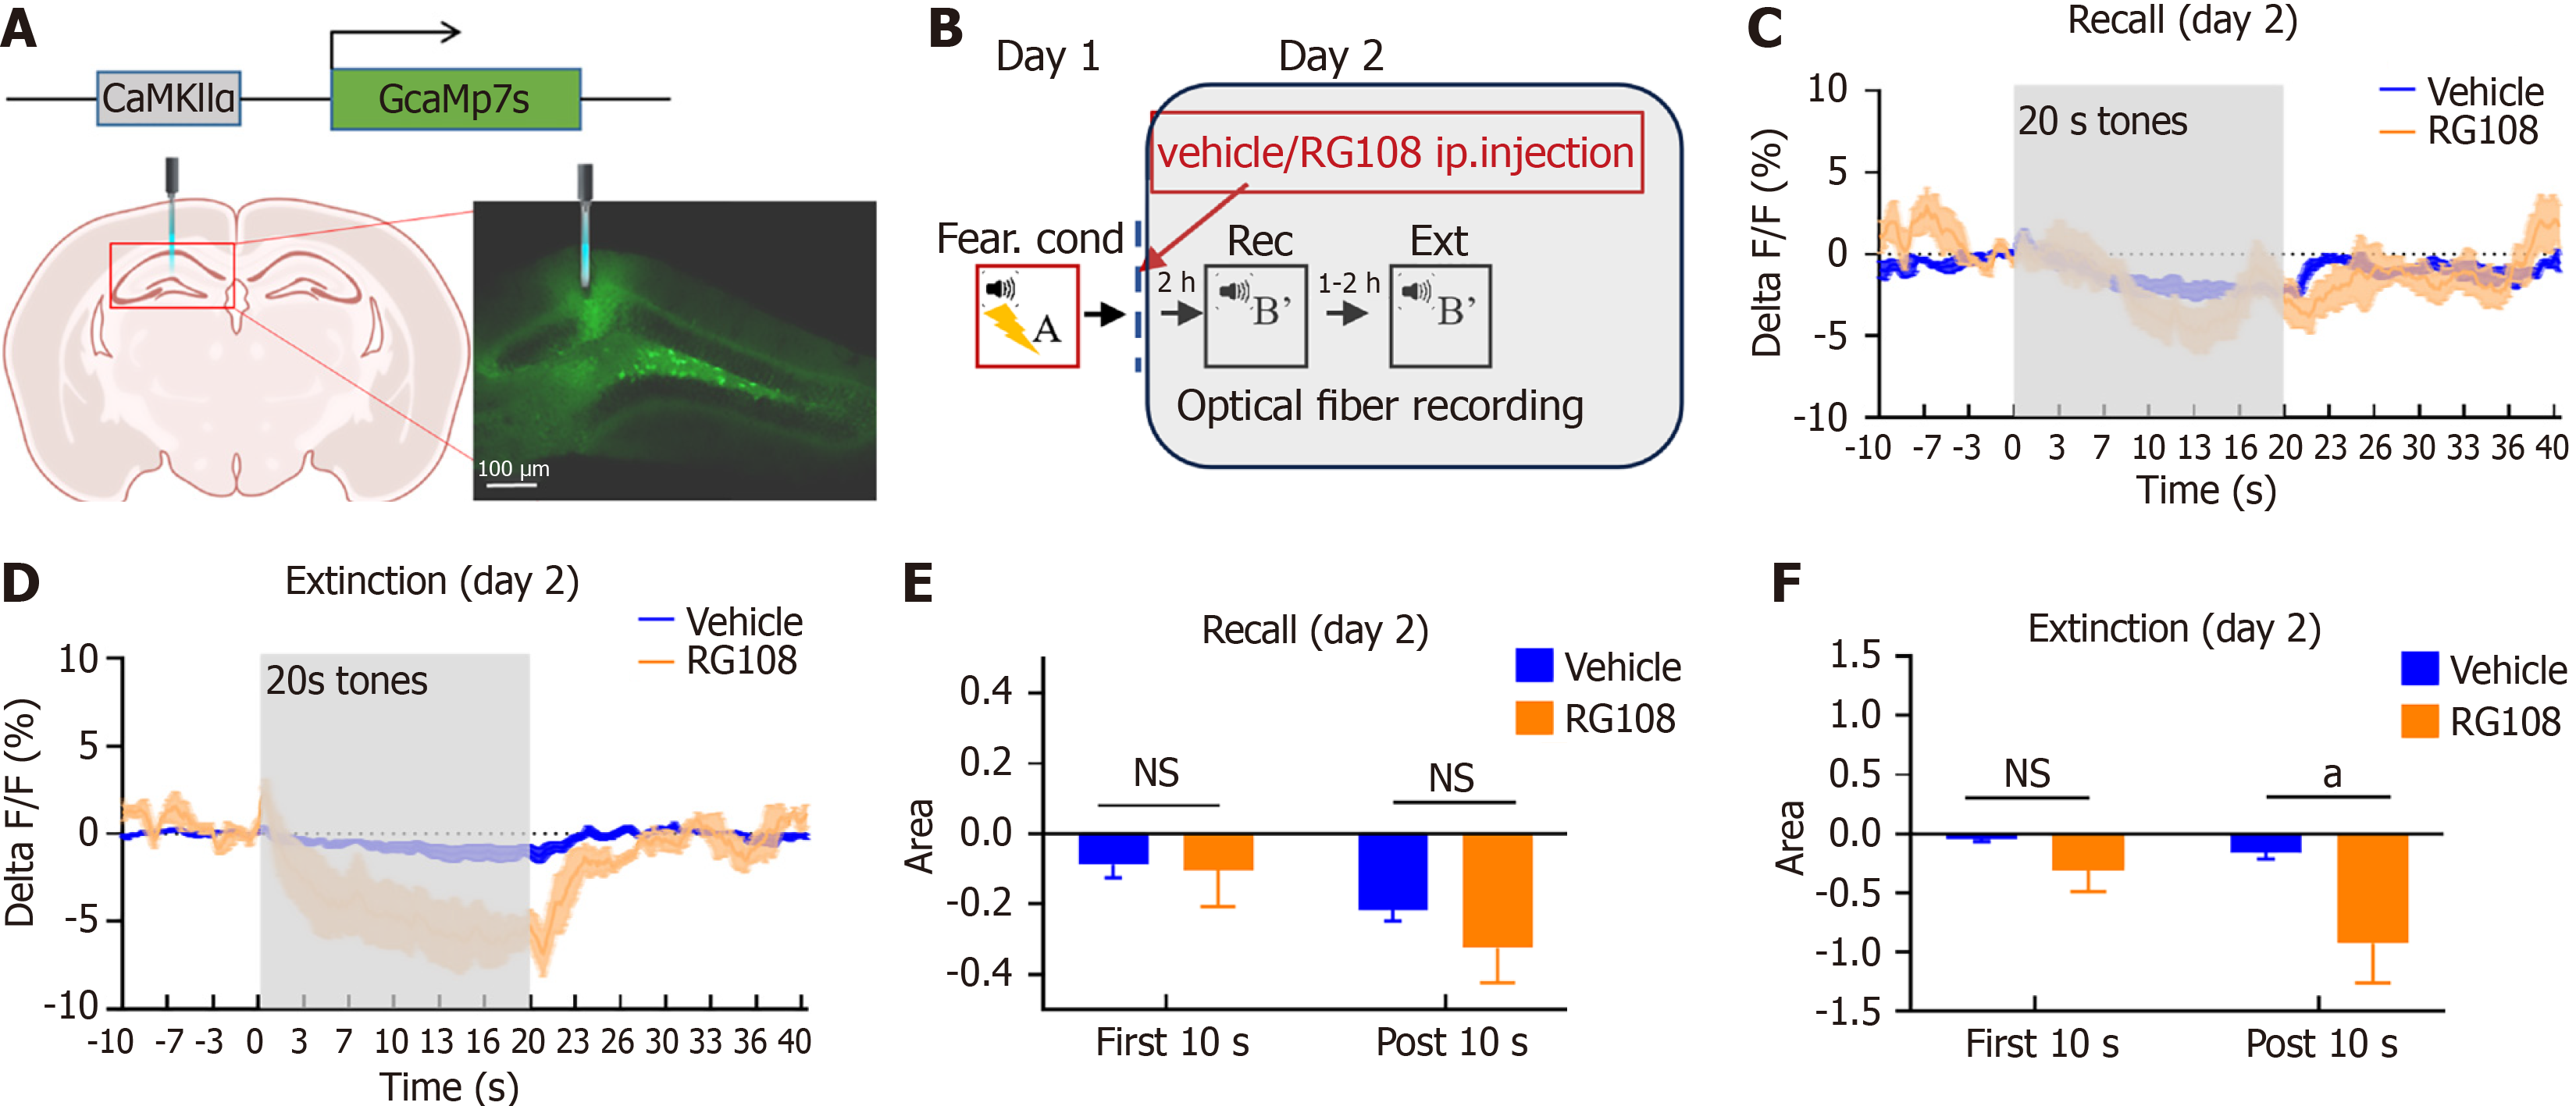
Figure 3 Calcium responses in dorsal dentate gyrus neurons during condition stimulus presentation.
A and B: Experimental procedures, neurons in dorsal dentate gyrus (dDG). Scale bars, 100 μm; C-F: Averaged population Ca2+ responses showed gradual reduction during condition stimulus (CS) presentations and quantification of changes in Ca2+ responses with area from the 20 s CS presentations; n = 3; E: Two-way RM ANOVA, F(1,4) = 0.3651, P = 0.5783; F: Two-way RM ANOVA, with multiple comparisons, F(1,4) = 3.888, P = 0.1199; first 10 s, T8 = 0.9554, P = 0.3674; post 10 s, T8 = 2.800, aP < 0.05; bP < 0.01; cP < 0.001.
- Citation: Jiang L, Ma RX, He ES, Zheng XY, Peng X, Ma WH, Li Y, li HW, Zhang XY, Ji JY, Li YJ, Qu SL, Li LJ, Gong ZT. DNA methylation regulates the extinction of fear memory. World J Psychiatry 2025; 15(7): 107524
- URL: https://www.wjgnet.com/2220-3206/full/v15/i7/107524.htm
- DOI: https://dx.doi.org/10.5498/wjp.v15.i7.107524


