Copyright
©The Author(s) 2025.
World J Psychiatry. Jun 19, 2025; 15(6): 105889
Published online Jun 19, 2025. doi: 10.5498/wjp.v15.i6.105889
Published online Jun 19, 2025. doi: 10.5498/wjp.v15.i6.105889
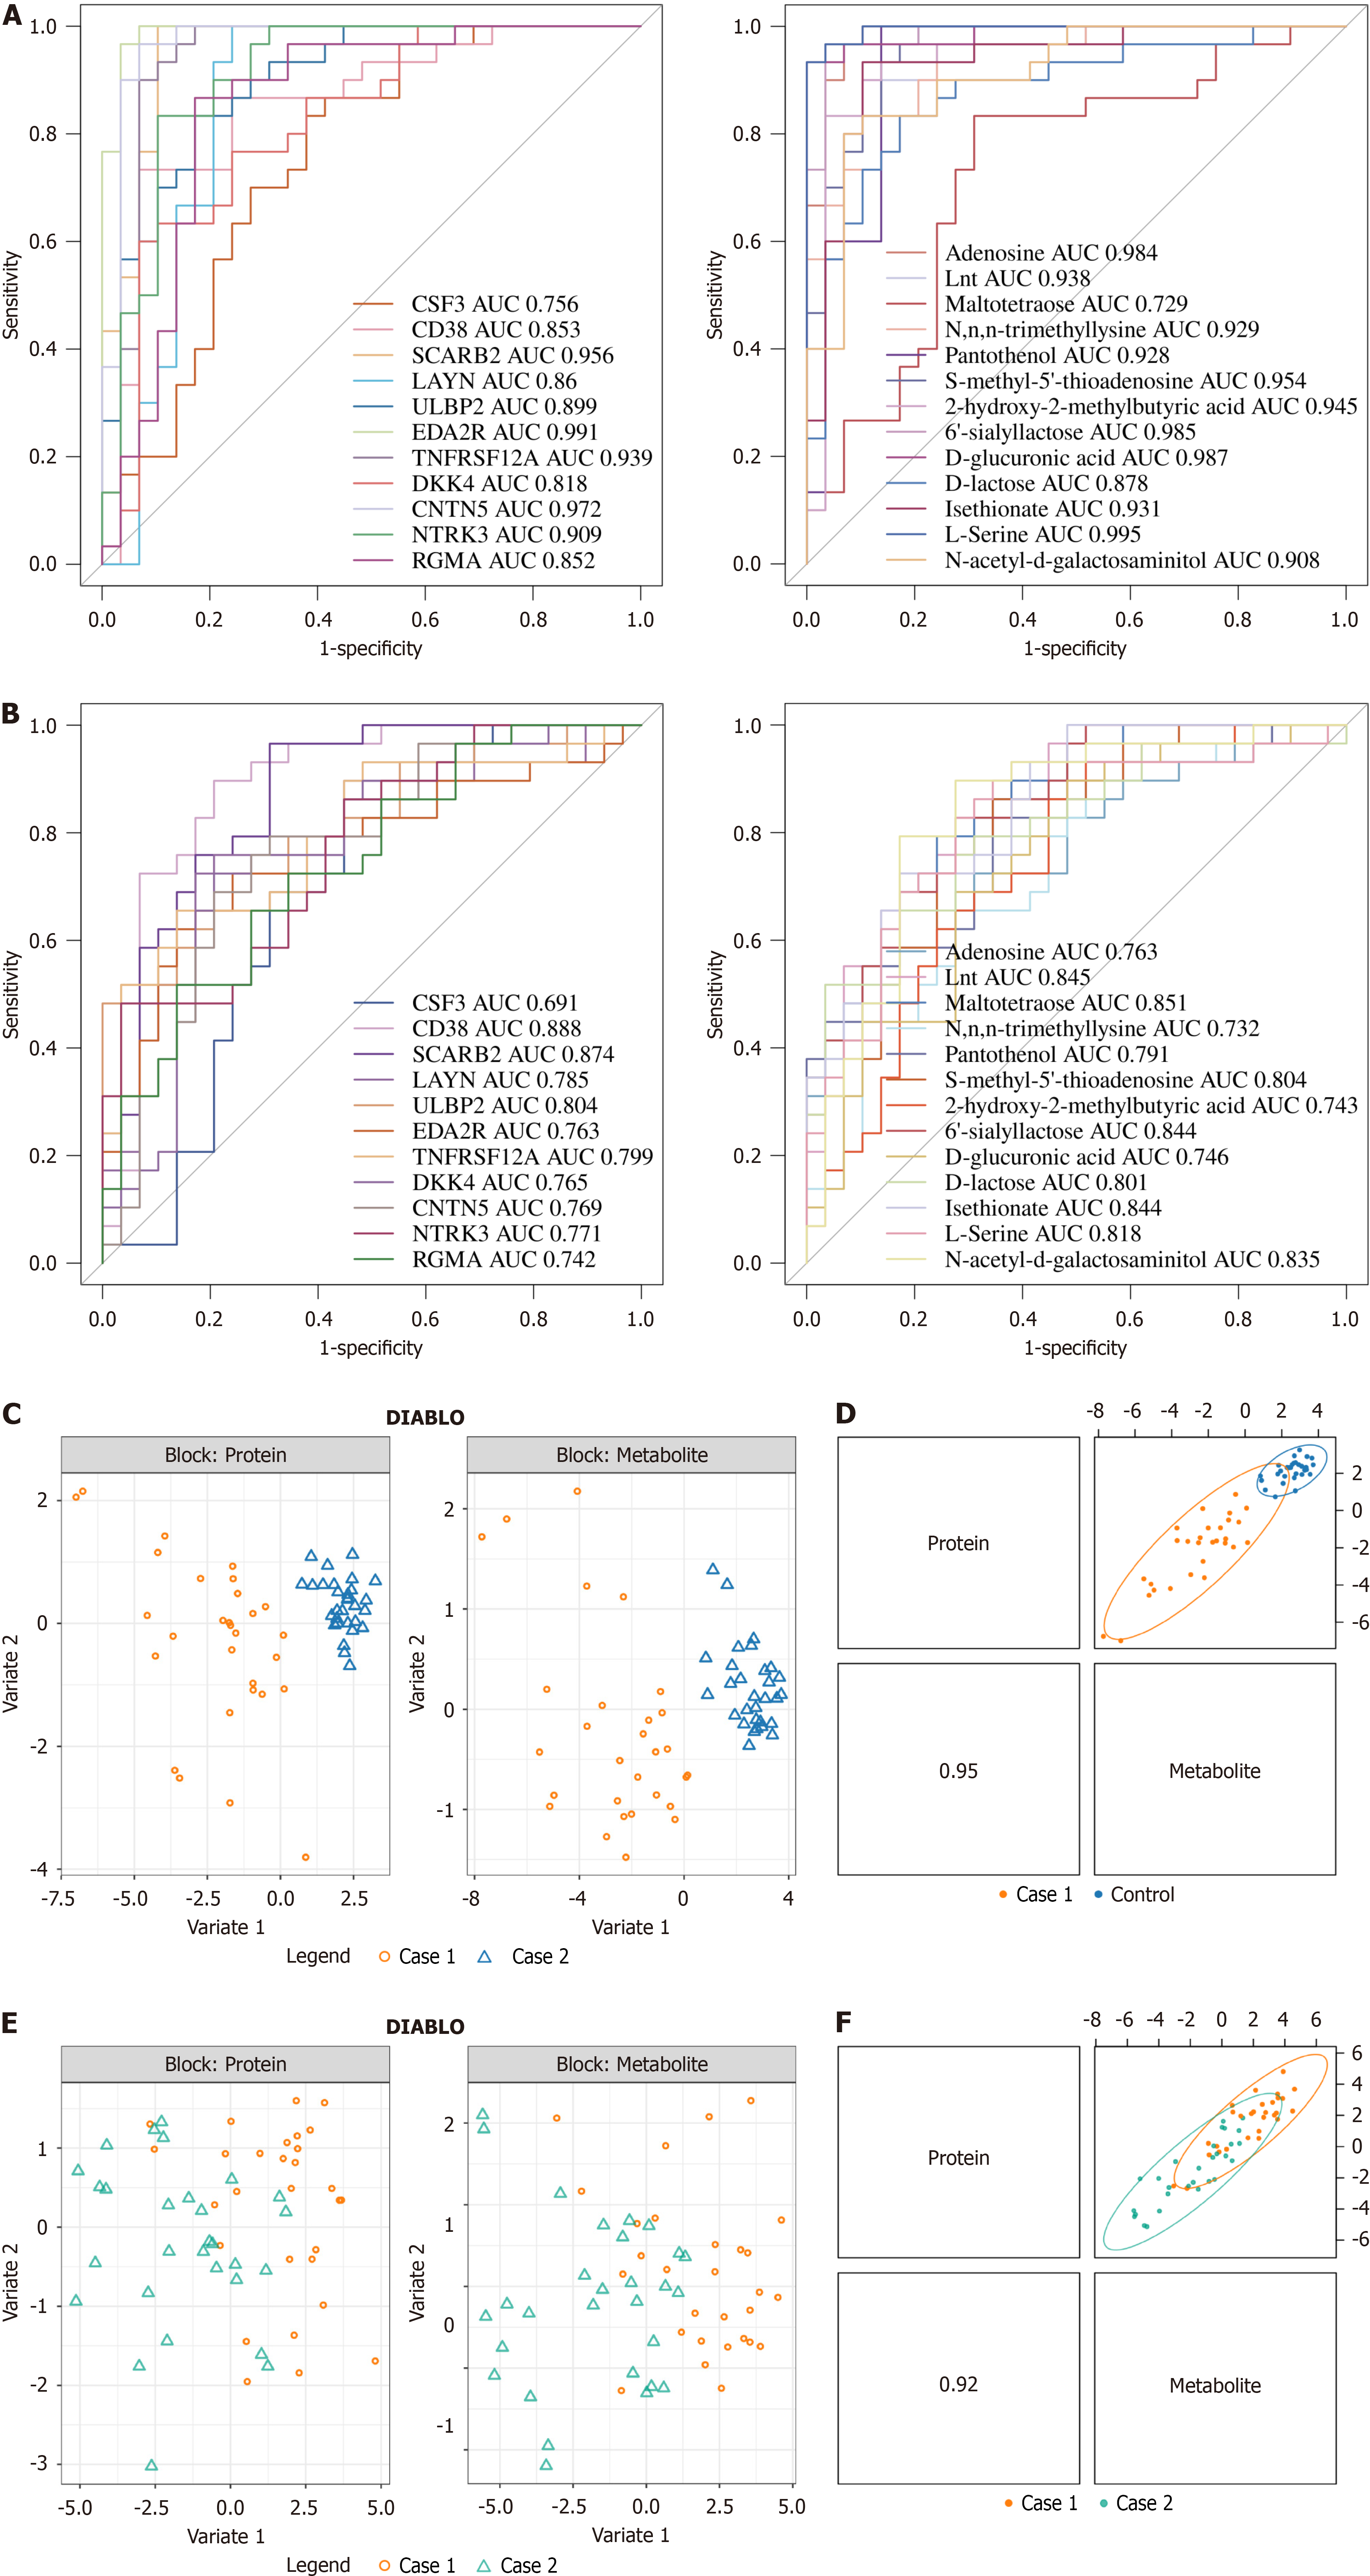
Figure 6 Receiver operating characteristic curves and Data Integration Analysis for Biomarker discovery using Latent cOmponents (DIABLO) model.
A: Receiver operating characteristic (ROC) curves for the modeling set. The left panel shows the protein ROC curve for sepsis vs control data. The right panel shows the metabolite biomarker ROC curve for sepsis vs control data; B: ROC curves for the validation set. The left panel shows the protein ROC curve for sepsis-associated encephalopathy (SAE) vs sepsis data. The right panel shows the metabolite biomarker ROC curve for SAE vs sepsis data. The horizontal axis represents the false positive rate, which is the proportion of true negatives incorrectly predicted as positives, also called specificity. The vertical axis represents the true positive rate, which is the proportion of true positives that are correctly predicted, also called sensitivity; C: In the DIABLO model, there is a significant difference between sepsis vs control in proteomics (left panel) and untargeted metabolomics (right panel) data; D: Pearson correlation between proteomics and the first component of untargeted metabolomics data in the DIABLO model for sepsis vs control; E: In the DIABLO model, there is a significant difference between SAE vs sepsis in proteomics (left panel) and untargeted metabolomics (right panel) data; F: Pearson correlation between proteomics and the first component of untargeted metabolomics data in the DIABLO model for SAE vs sepsis. AUC: Area under the curve; DIABLO: Data Integration Analysis for Biomarker discovery using Latent cOmponents.
- Citation: Wu CR, Zhu HL, Sun YT, Shen SH, Shi PL, Cui YH, Tang JG, Yang CH, Wang SY, Ge XL, Pan SM. Clinical manifestations of anxiety and depression in sepsis-associated encephalopathy and multi-omics identification of cluster of differentiation 38 as an early biomarker. World J Psychiatry 2025; 15(6): 105889
- URL: https://www.wjgnet.com/2220-3206/full/v15/i6/105889.htm
- DOI: https://dx.doi.org/10.5498/wjp.v15.i6.105889


