Copyright
©The Author(s) 2025.
World J Psychiatry. Jun 19, 2025; 15(6): 105889
Published online Jun 19, 2025. doi: 10.5498/wjp.v15.i6.105889
Published online Jun 19, 2025. doi: 10.5498/wjp.v15.i6.105889
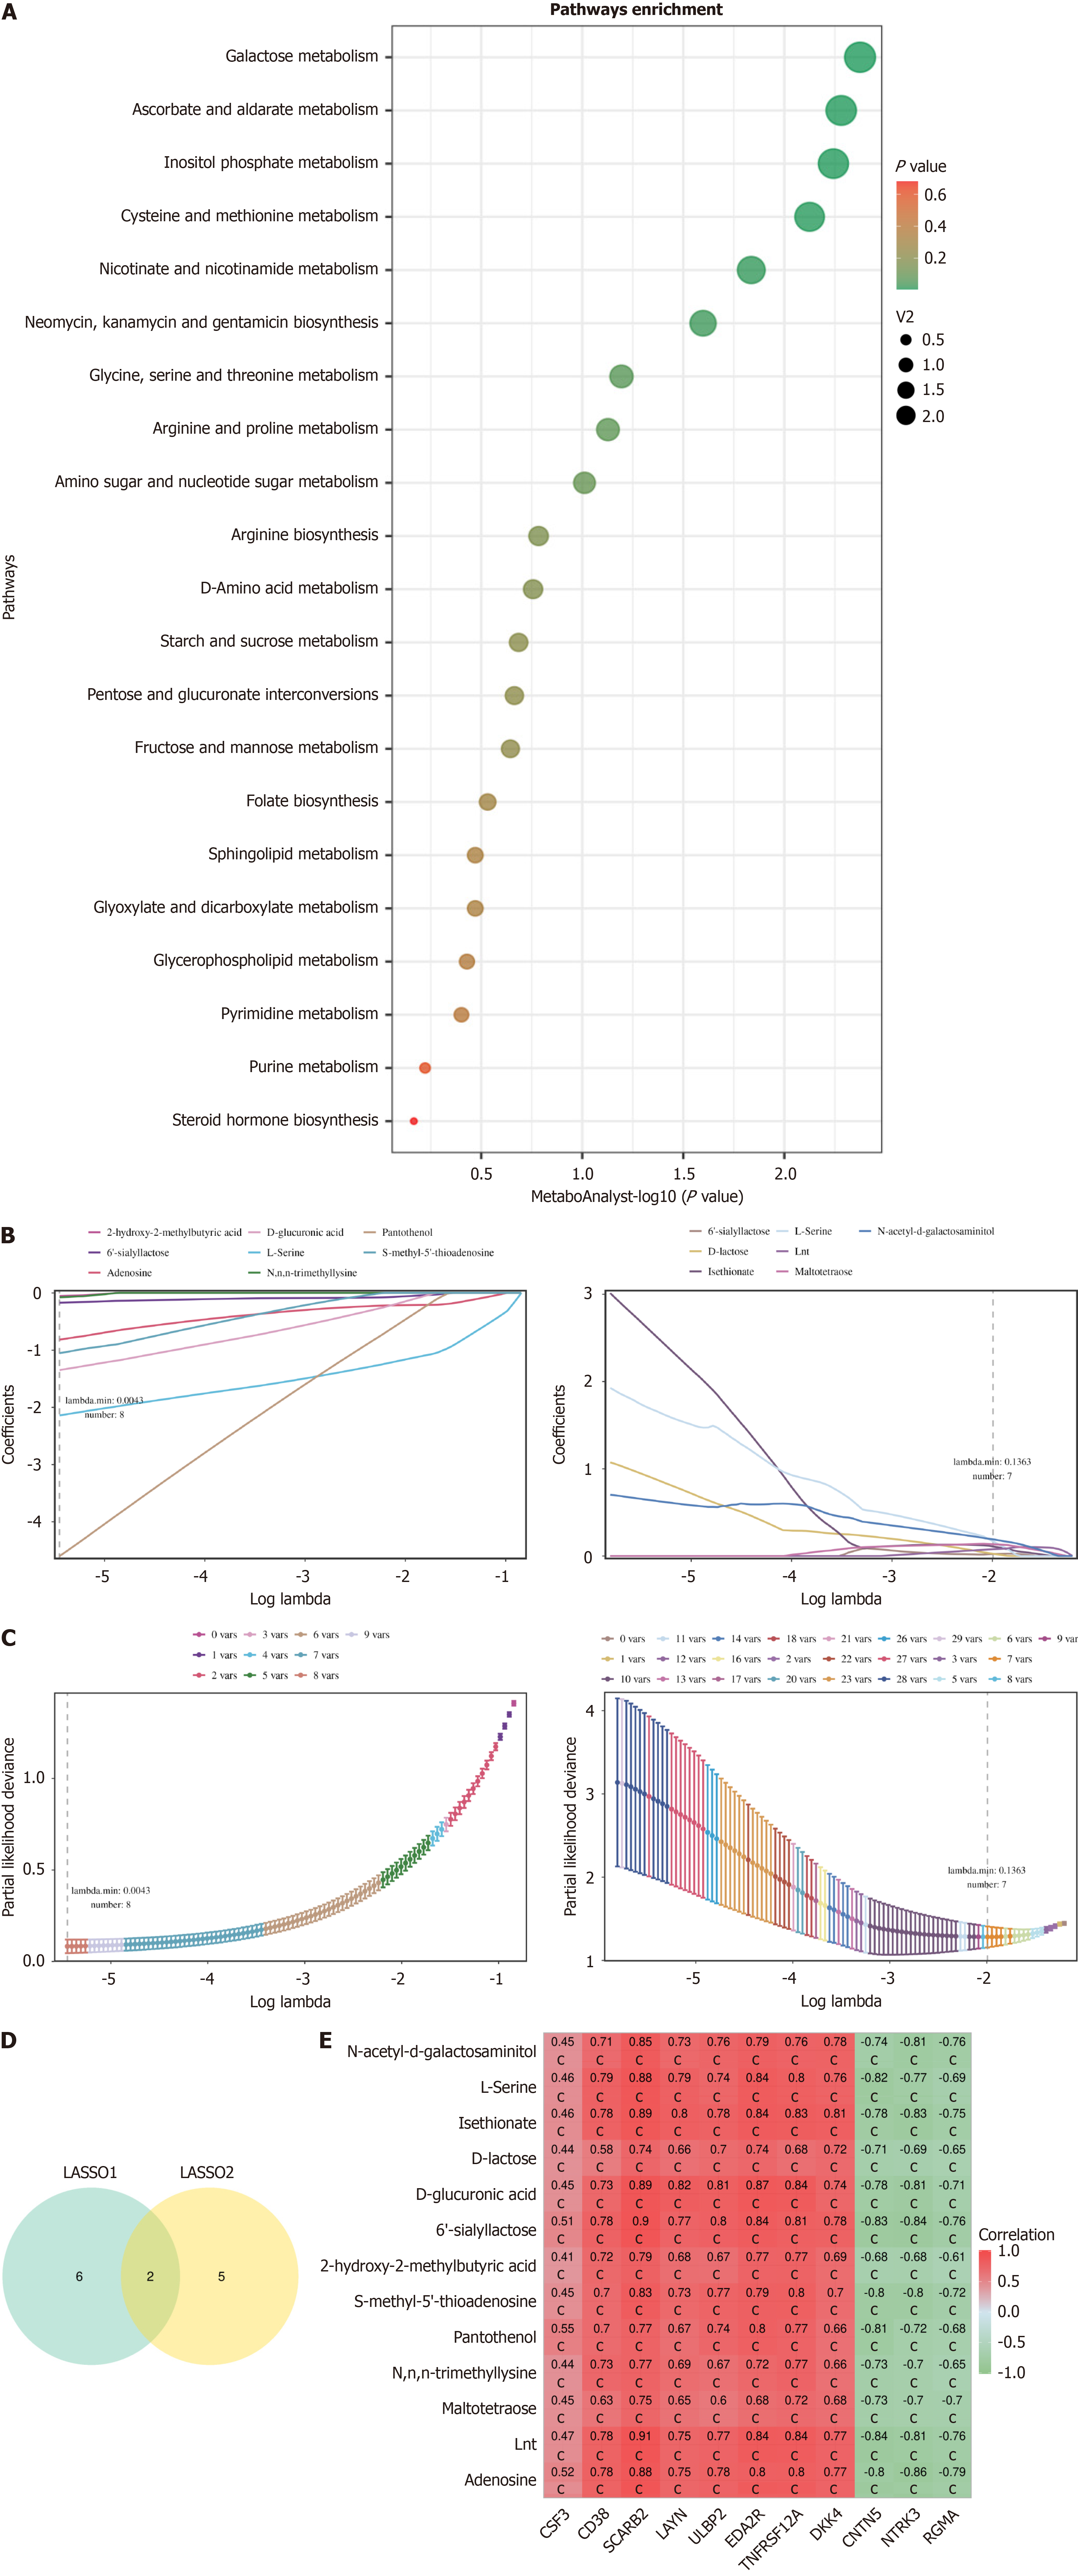
Figure 5 Metabolite enrichment analysis and identification of key metabolites.
A: Pathway analysis. The horizontal axis represents significance, and the vertical axis represents pathway names; B: Metabolite coefficient plot. The horizontal axis represents the logarithmic value of λ; the vertical axis represents the regression coefficient. The curve illustrates the relationship between the regression coefficient of the variable (metabolite) and λ; C: Cross-validation error plot. The horizontal axis represents log (λ) values, and the vertical axis represents degrees of freedom. The dashed line represents the λ corresponding to the minimum error mean. The numbers above the graph represent the number of metabolites corresponding to different λ values; D: Union of results from two machine learning algorithms; E: Correlation heatmap between key metabolites and key proteins. The horizontal axis represents proteins, the vertical axis represents metabolites, and the numbers in the figure represent the correlation coefficients between them. cP < 0.001. LASSO: Least absolute shrinkage and selection operator.
- Citation: Wu CR, Zhu HL, Sun YT, Shen SH, Shi PL, Cui YH, Tang JG, Yang CH, Wang SY, Ge XL, Pan SM. Clinical manifestations of anxiety and depression in sepsis-associated encephalopathy and multi-omics identification of cluster of differentiation 38 as an early biomarker. World J Psychiatry 2025; 15(6): 105889
- URL: https://www.wjgnet.com/2220-3206/full/v15/i6/105889.htm
- DOI: https://dx.doi.org/10.5498/wjp.v15.i6.105889


