Copyright
©The Author(s) 2025.
World J Psychiatry. Jun 19, 2025; 15(6): 105555
Published online Jun 19, 2025. doi: 10.5498/wjp.v15.i6.105555
Published online Jun 19, 2025. doi: 10.5498/wjp.v15.i6.105555
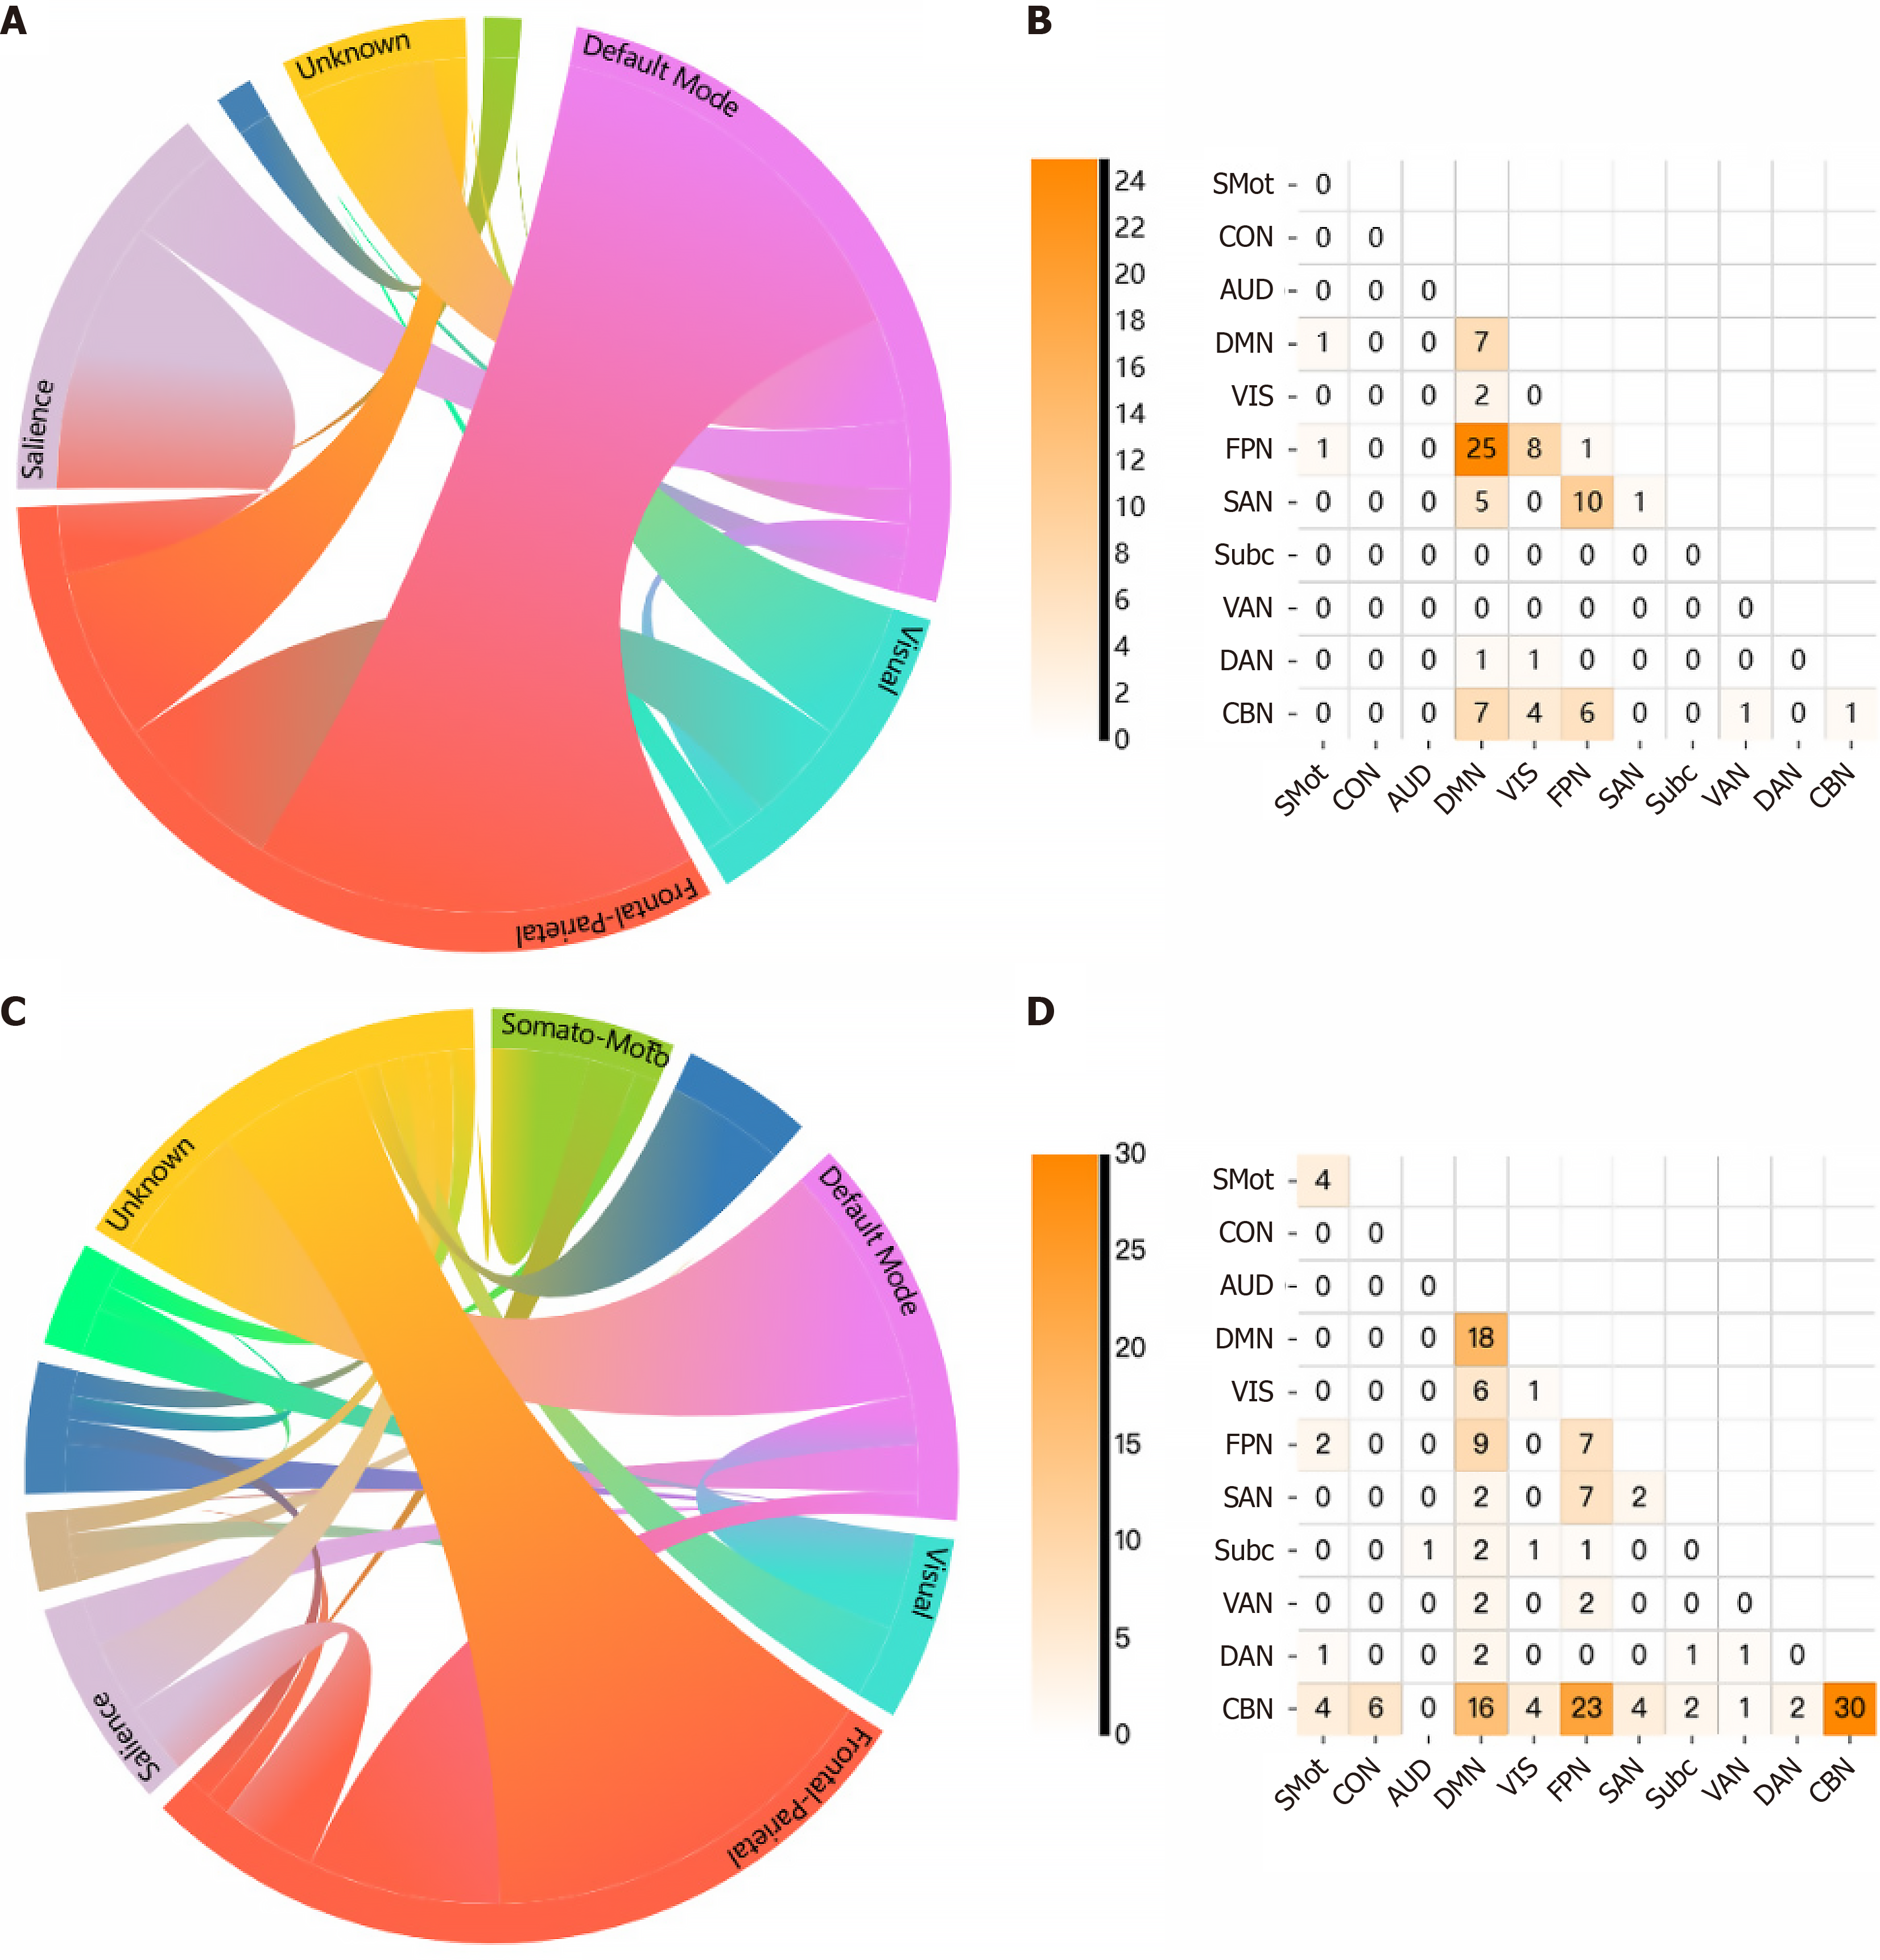
Figure 2 Results of significantly different edges between rumination and distraction states.
A: The chord map of the higher functional connectivity (FC) during rumination. Different color represents different subnetwork. A chord connecting two subnetworks indicates that there is a significant FC between the two subnetworks, where the thickness represents the number of significant FC; B: The matrix map shows the number of significantly higher FC between subnetworks during rumination; C: The chord map of the lower FC during rumination; D: The matrix map shows the number of significantly lower FC between subnetworks during rumination, compared to distraction state. SMot: Motor and somatosensory; CON: Cingulo-opercular; AUD: Auditory; DMN: Default mode; VIS: Visual; FPN: Frontoparietal; SAN: Salience; Subc: Subcortical; VAN: Ventral attention; DAN: Dorsal attention; CBN: Cerebellar network. All the figures above were drawn by Bioimage Suite (https://bioimagesuiteweb.github.io/webapp/connviewer.html?species=human#).
- Citation: Li KN, Tang SX, Tao YF, He HR, Ma MH, Zhang QQ, Huang M, Chen WT, Liang H, Deng AQ, Gao SR, Meng FY, Peng YL, Ju YM, Ou WW, Shu S, Zhang Y. Neural correlates of rumination in remitted depressive episodes: Brain network connectivity and topology analyses. World J Psychiatry 2025; 15(6): 105555
- URL: https://www.wjgnet.com/2220-3206/full/v15/i6/105555.htm
- DOI: https://dx.doi.org/10.5498/wjp.v15.i6.105555


