Copyright
©The Author(s) 2025.
World J Psychiatry. Jun 19, 2025; 15(6): 104809
Published online Jun 19, 2025. doi: 10.5498/wjp.v15.i6.104809
Published online Jun 19, 2025. doi: 10.5498/wjp.v15.i6.104809
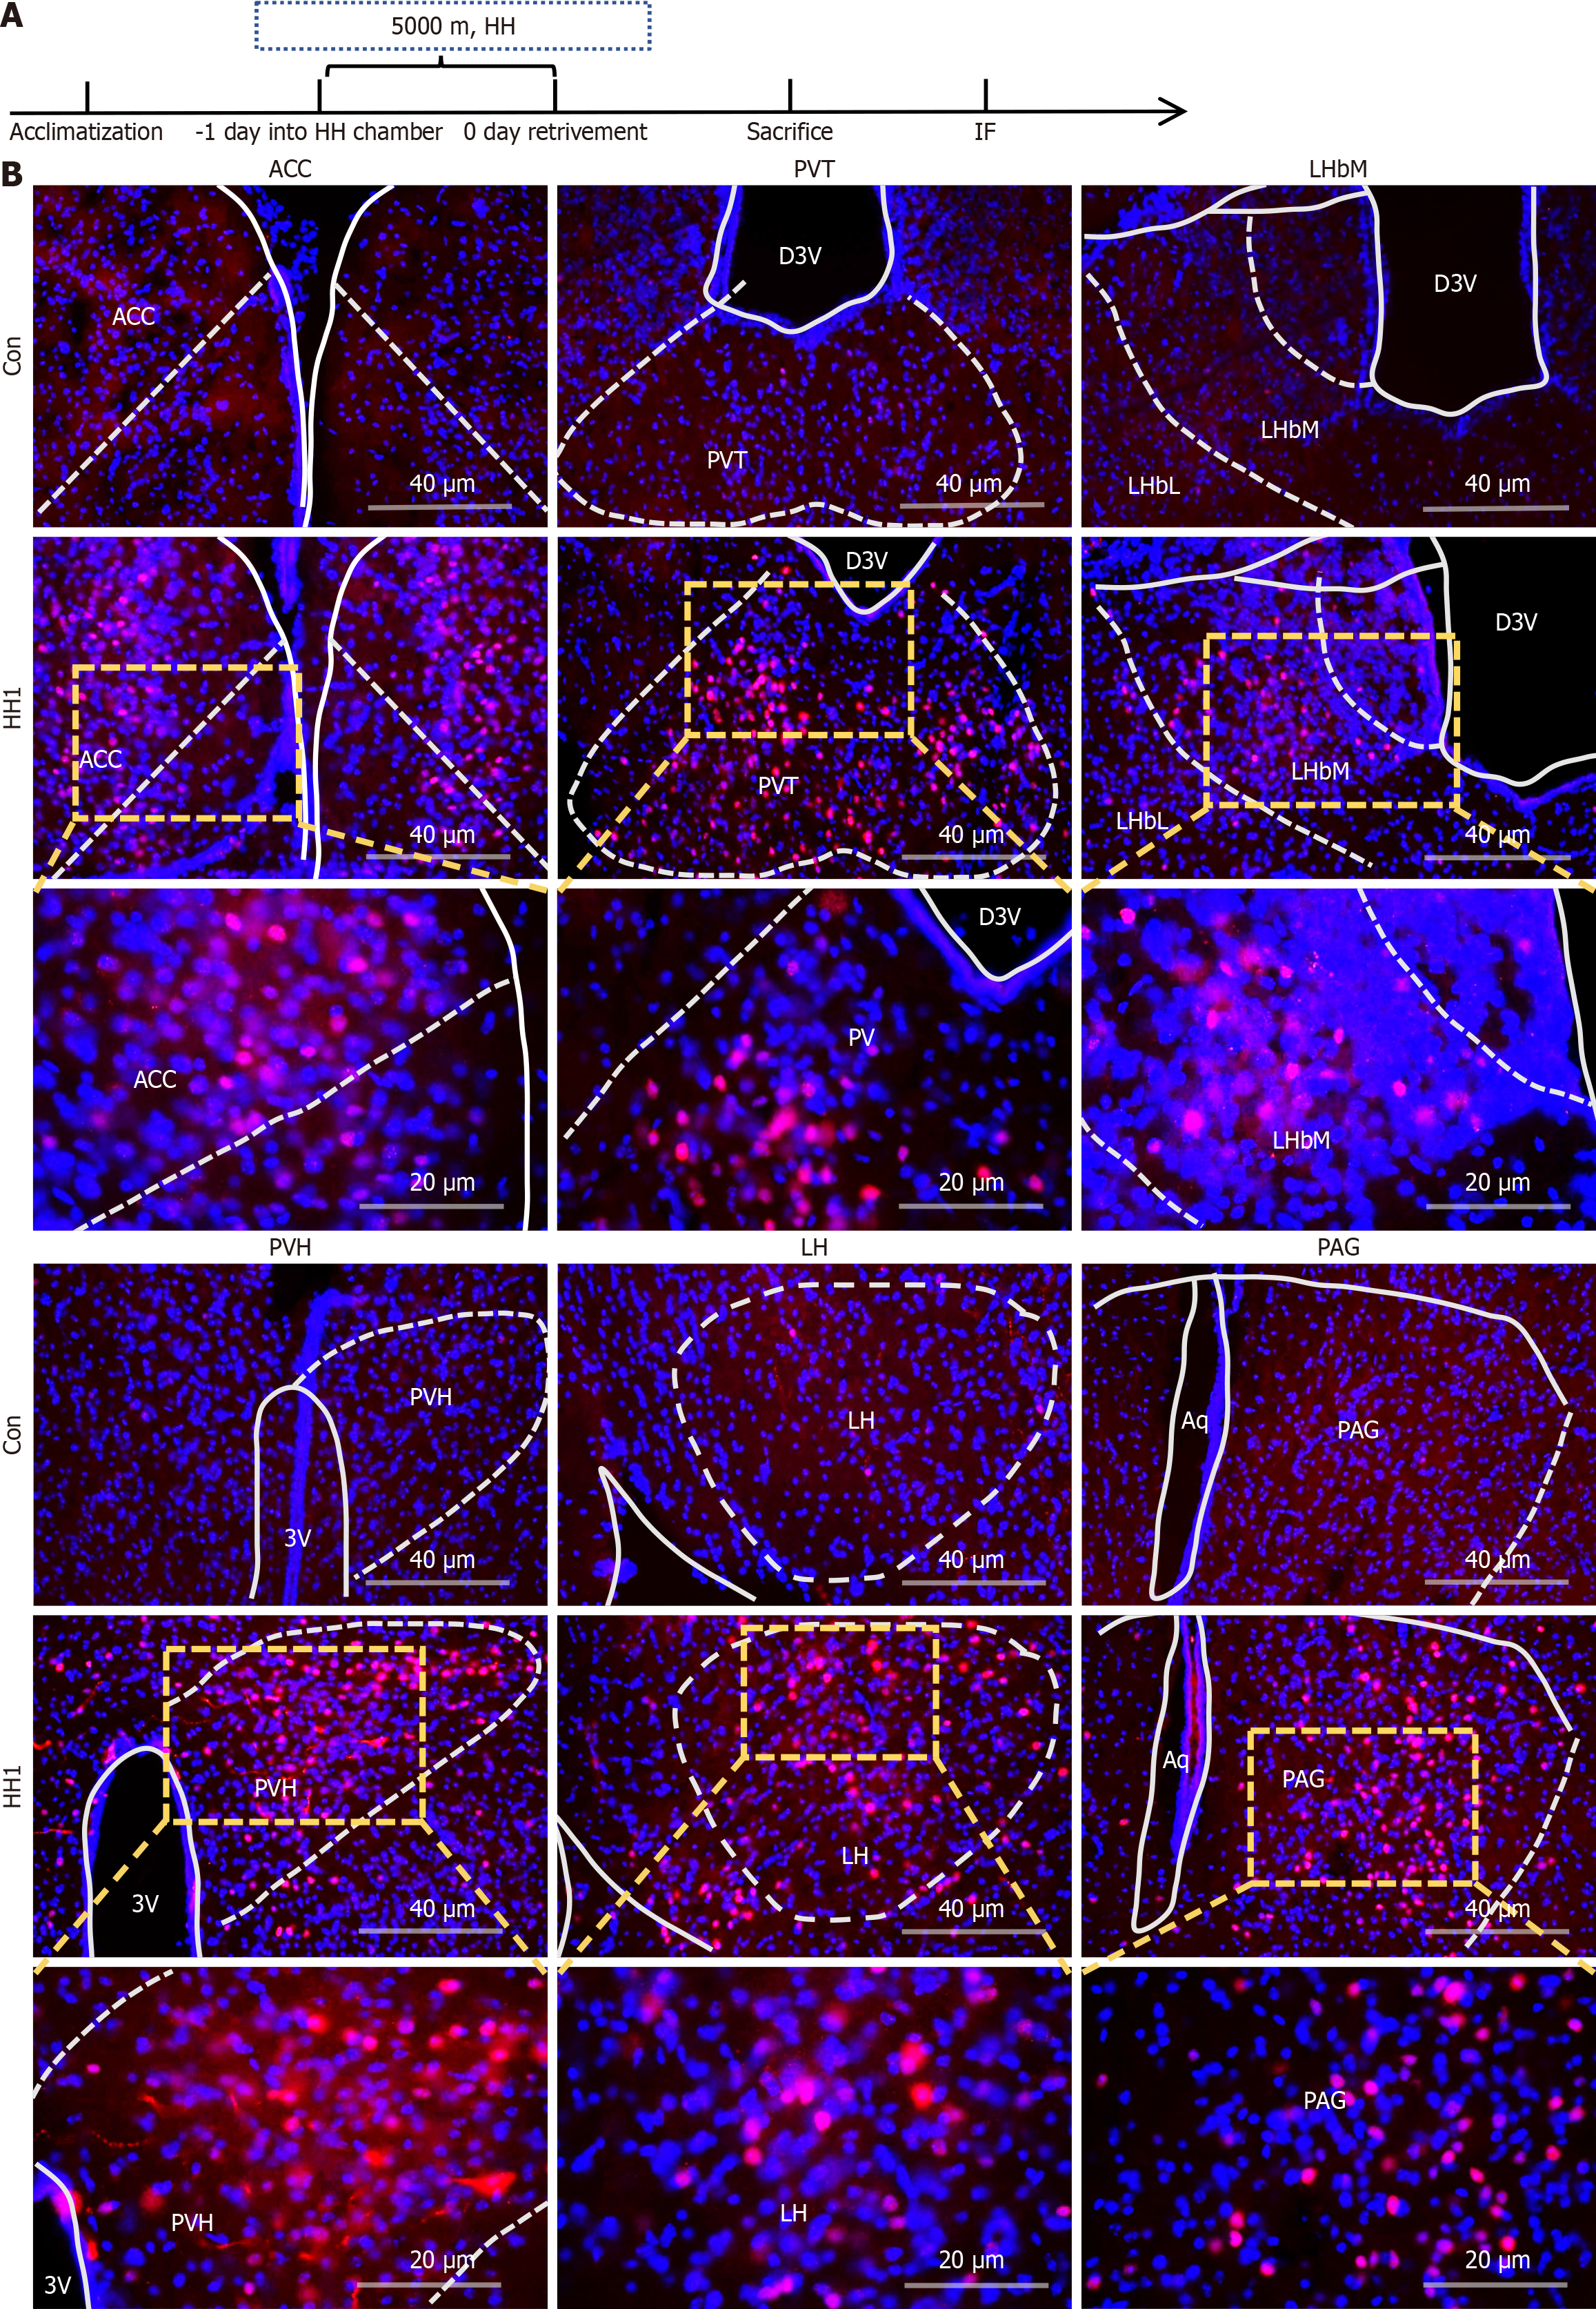
Figure 3 c-Fos expression in nuclei, indicating activation in certain brain regions after 1-day hypobaric hypoxia exposure.
A: One day of hypobaric hypoxia exposure paradigm; B: Expression of c-Fos in the anterior cingulate cortex, paraventricular thalamic nucleus, lateral habenula nucleus, paraventricular nuclei of the hypothalamus, lateral hypothalamus, and anterior periaqueductal gray. Con: Control group; HH1: One day of hypobaric hypoxia exposure; HH: Hypobaric hypoxia; IF: Immunofluorescence staining; ACC: Anterior cingulate cortex; PVT: Paraventricular thalamic nucleus; LHbM: Lateral habenular nucleus, medial part; LHbI: Lateral habenular nucleus, lateral part; D3V: Dorsal part of the third ventricle; PVH: Paraventricular nuclei of the hypothalamus; 3V: Third ventricle; LH: Lateral hypothalamus; PAG: Periaqueductal gray; Aq: Aqueduct of Sylvius.
- Citation: Chang WY, Qin QZ, Li XT, Wang JJ, Chen Y, Ruan HQ, Qu YN, Jiang XX, He HX. Modulating oral microbiota ameliorates hypobaric hypoxia-induced anxiety- and depression-like behaviors in mice. World J Psychiatry 2025; 15(6): 104809
- URL: https://www.wjgnet.com/2220-3206/full/v15/i6/104809.htm
- DOI: https://dx.doi.org/10.5498/wjp.v15.i6.104809


