
















©The Author(s) 2025.
World J Psychiatry. Dec 19, 2025; 15(12): 111972
Published online Dec 19, 2025. doi: 10.5498/wjp.v15.i12.111972
Published online Dec 19, 2025. doi: 10.5498/wjp.v15.i12.111972
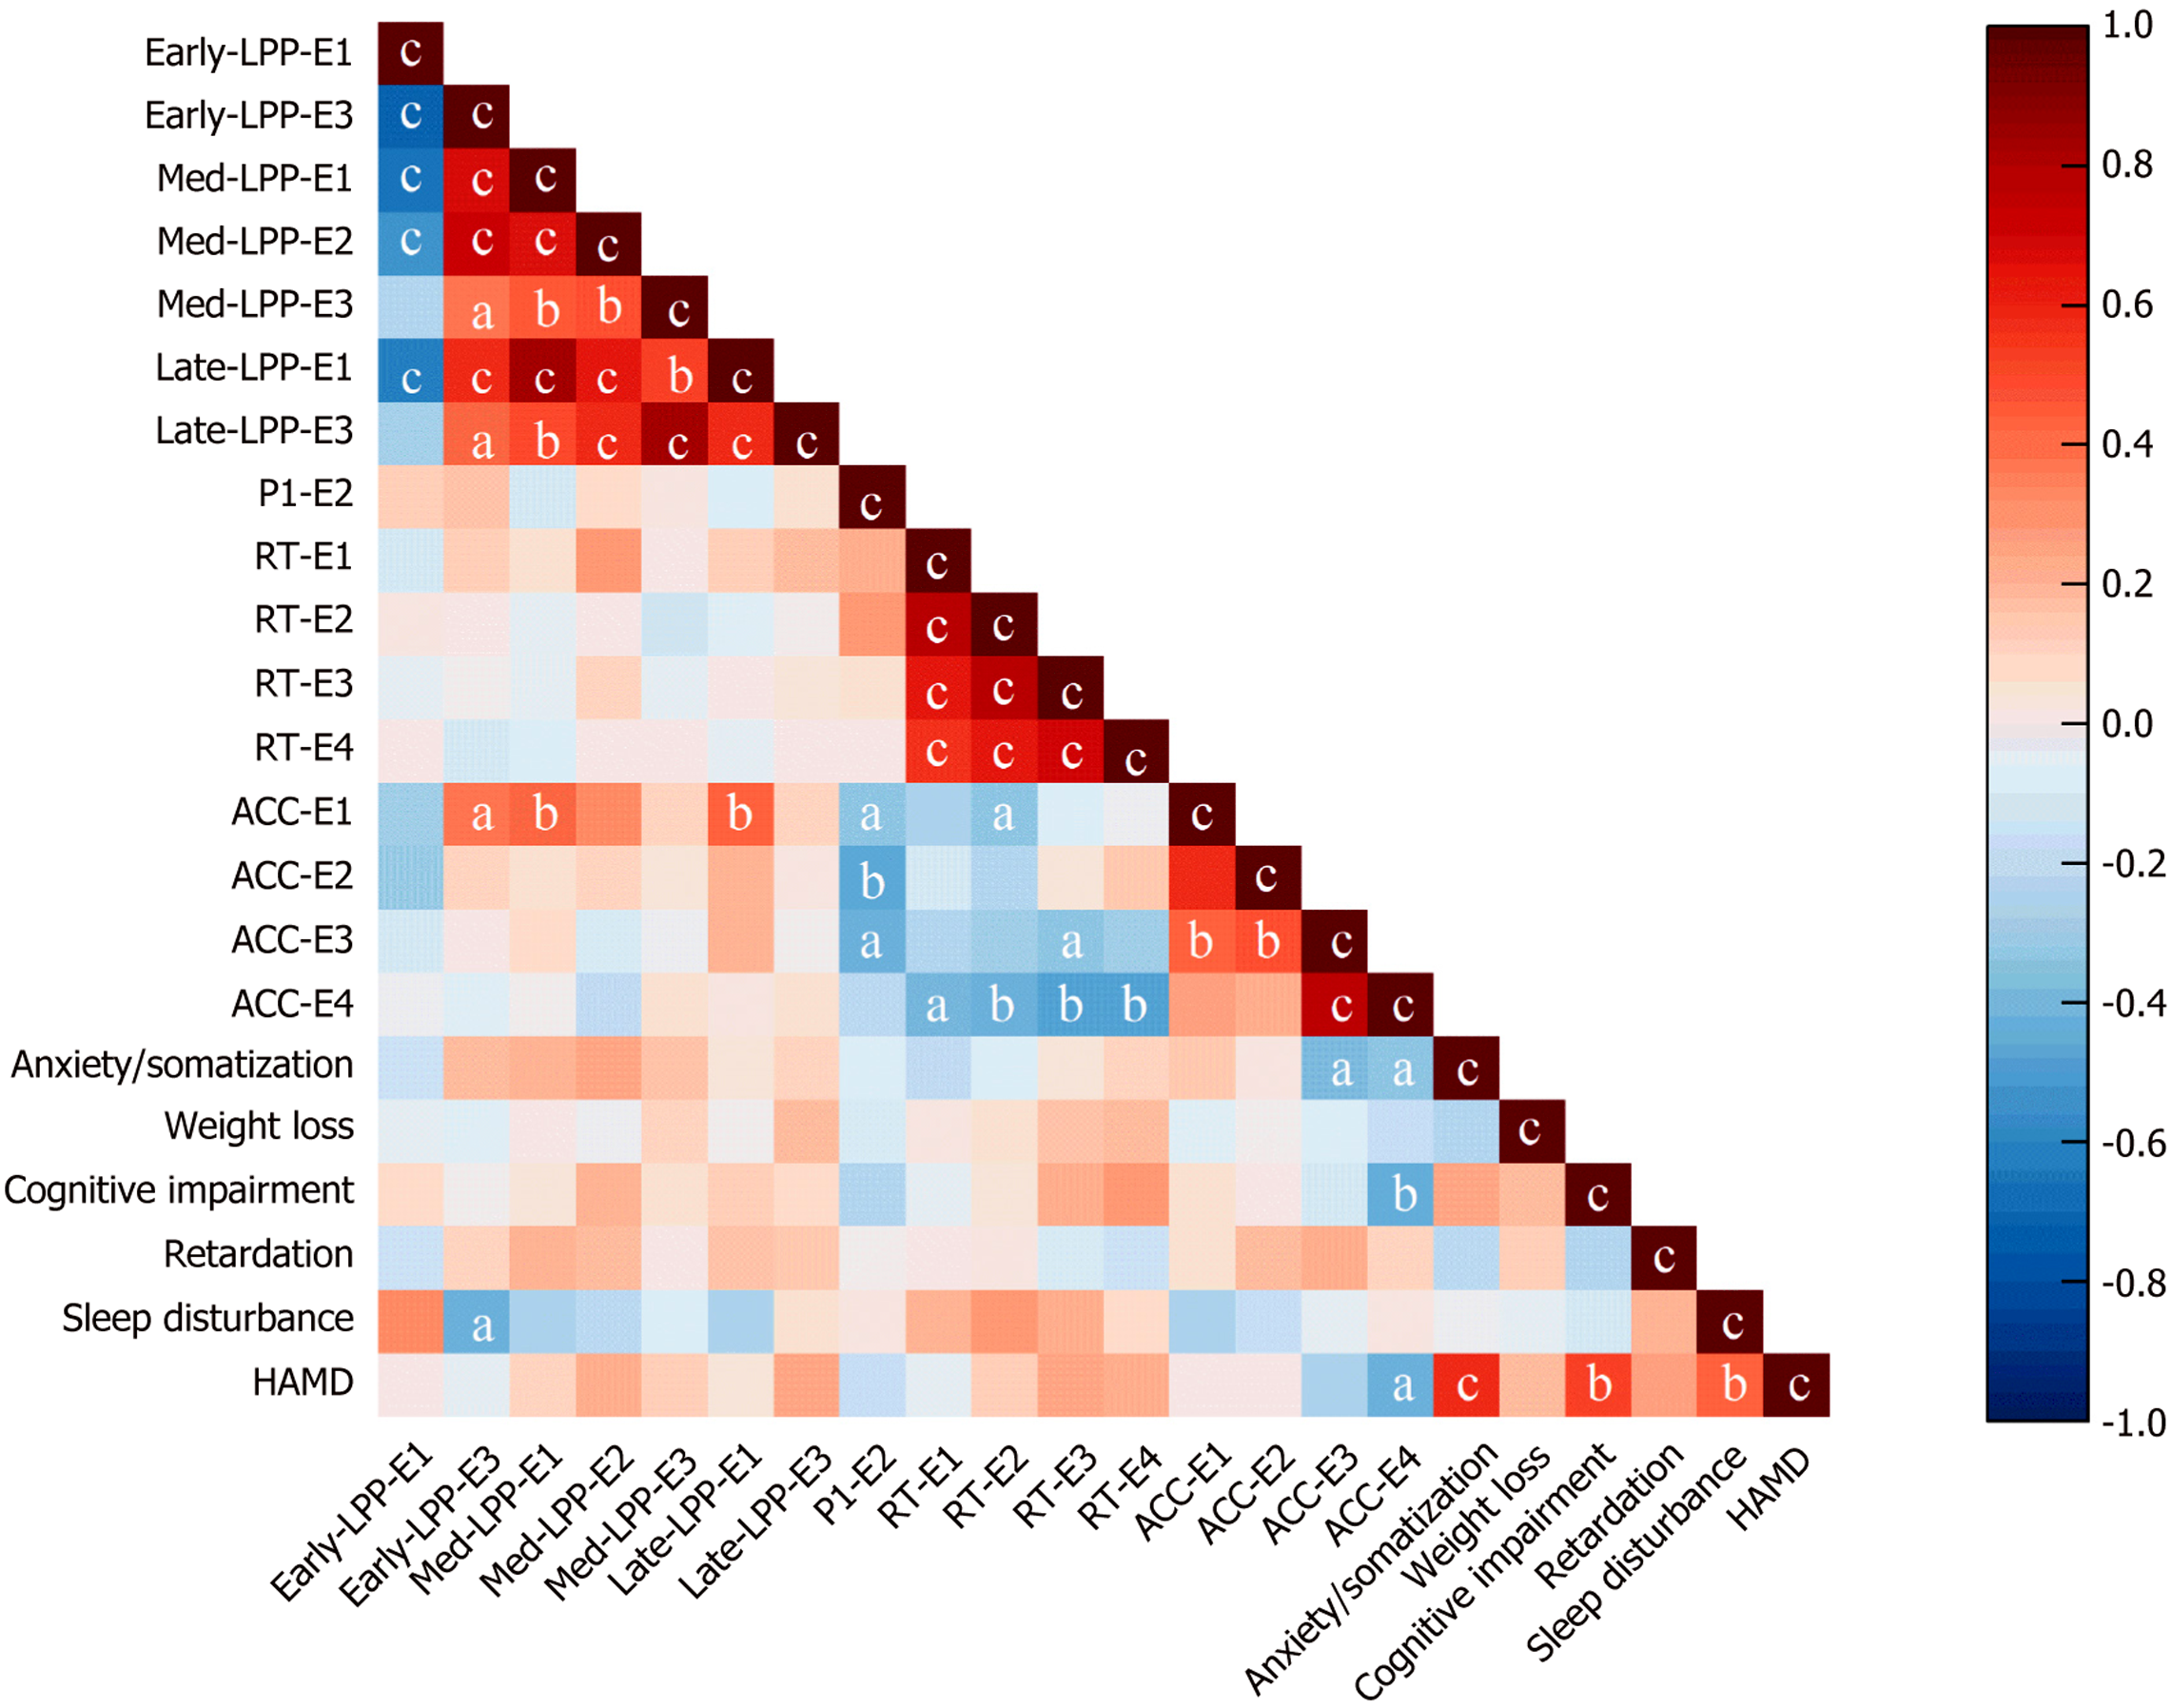
Figure 7 Heat map for correlations among variables in major depression group.
Positive correlations are indicated in red, while negative correlations are marked in blue. aP < 0.05; bP < 0.01, cP < 0.001. MD: Major depression; HAMD: Hamilton Depression Scale; Early-LPP-E1: Late positive potentials early phase of experiment 1; Early-LPP-E3: Late positive potentials early phase of experiment 3; Med-LPP-E1: Late positive potentials medium phase of experiment 1; Med-LPP-E2: Late positive potentials medium phase of experiment 2; Med-LPP-E3: Late positive potentials medium phase of experiment 3; Late-LPP-E1: Late positive potentials late phase of experiment 1; Late-LPP-E3: Late positive potentials late phase of experiment 3; P1-E2: The P100 of experiment 2.
- Citation: Li JX, Lu MC, Wu LA, Li W, Li Y, Li XP, Liu XH, Gao XZ, Zhou ZH, Zhou HL. Neural correlates of conditional reasoning dysfunction in major depression: An event-related potential study with the Wason selection task. World J Psychiatry 2025; 15(12): 111972
- URL: https://www.wjgnet.com/2220-3206/full/v15/i12/111972.htm
- DOI: https://dx.doi.org/10.5498/wjp.v15.i12.111972