
















©The Author(s) 2025.
World J Psychiatry. Dec 19, 2025; 15(12): 111972
Published online Dec 19, 2025. doi: 10.5498/wjp.v15.i12.111972
Published online Dec 19, 2025. doi: 10.5498/wjp.v15.i12.111972
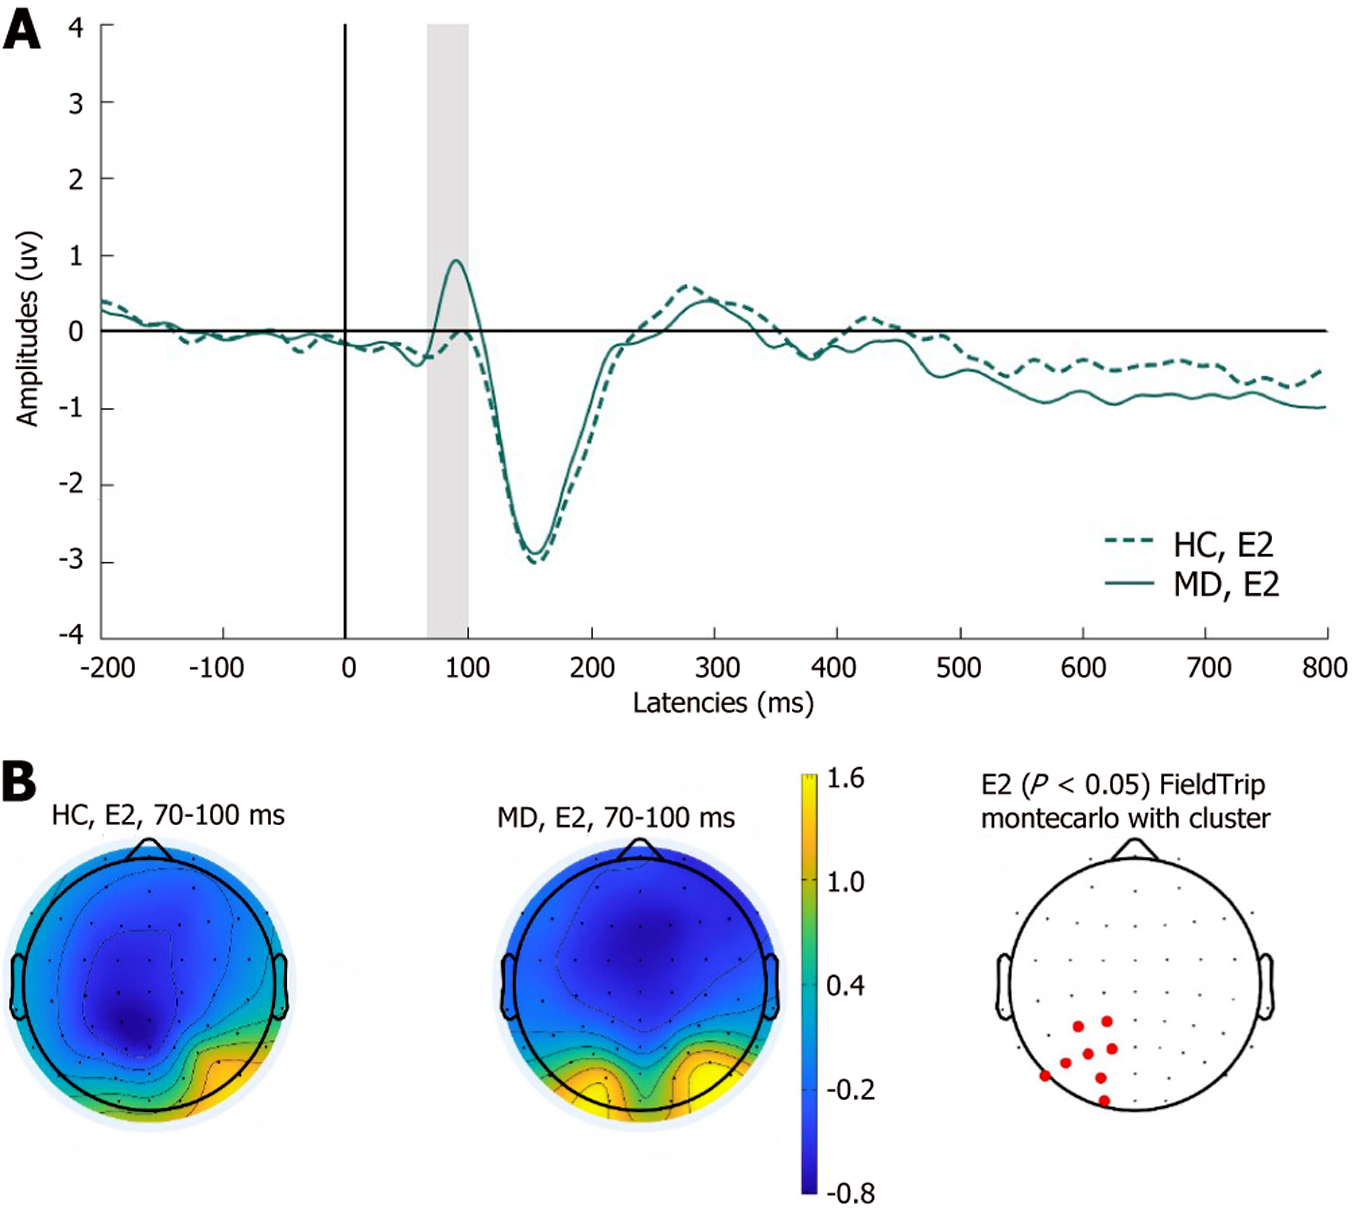
Figure 3 Grand averaged P100 and topographical distribution of both healthy control and major depression groups.
A: Grand averaged event-related potentials of experiment 2 in the healthy control (HC) group and major depression (MD) group; The time window corresponding to P100 is indicated by the gray shaded area; B: A topography map of the experiment 2 condition depicting the grand average amplitude of the difference wave within the 70-100 ms timeframe for the HC group and the MD group. HC: Healthy controls; MD: Major depression; E2: Precautionary Wason selection task.
- Citation: Li JX, Lu MC, Wu LA, Li W, Li Y, Li XP, Liu XH, Gao XZ, Zhou ZH, Zhou HL. Neural correlates of conditional reasoning dysfunction in major depression: An event-related potential study with the Wason selection task. World J Psychiatry 2025; 15(12): 111972
- URL: https://www.wjgnet.com/2220-3206/full/v15/i12/111972.htm
- DOI: https://dx.doi.org/10.5498/wjp.v15.i12.111972