
















©The Author(s) 2025.
World J Psychiatry. Dec 19, 2025; 15(12): 111754
Published online Dec 19, 2025. doi: 10.5498/wjp.v15.i12.111754
Published online Dec 19, 2025. doi: 10.5498/wjp.v15.i12.111754
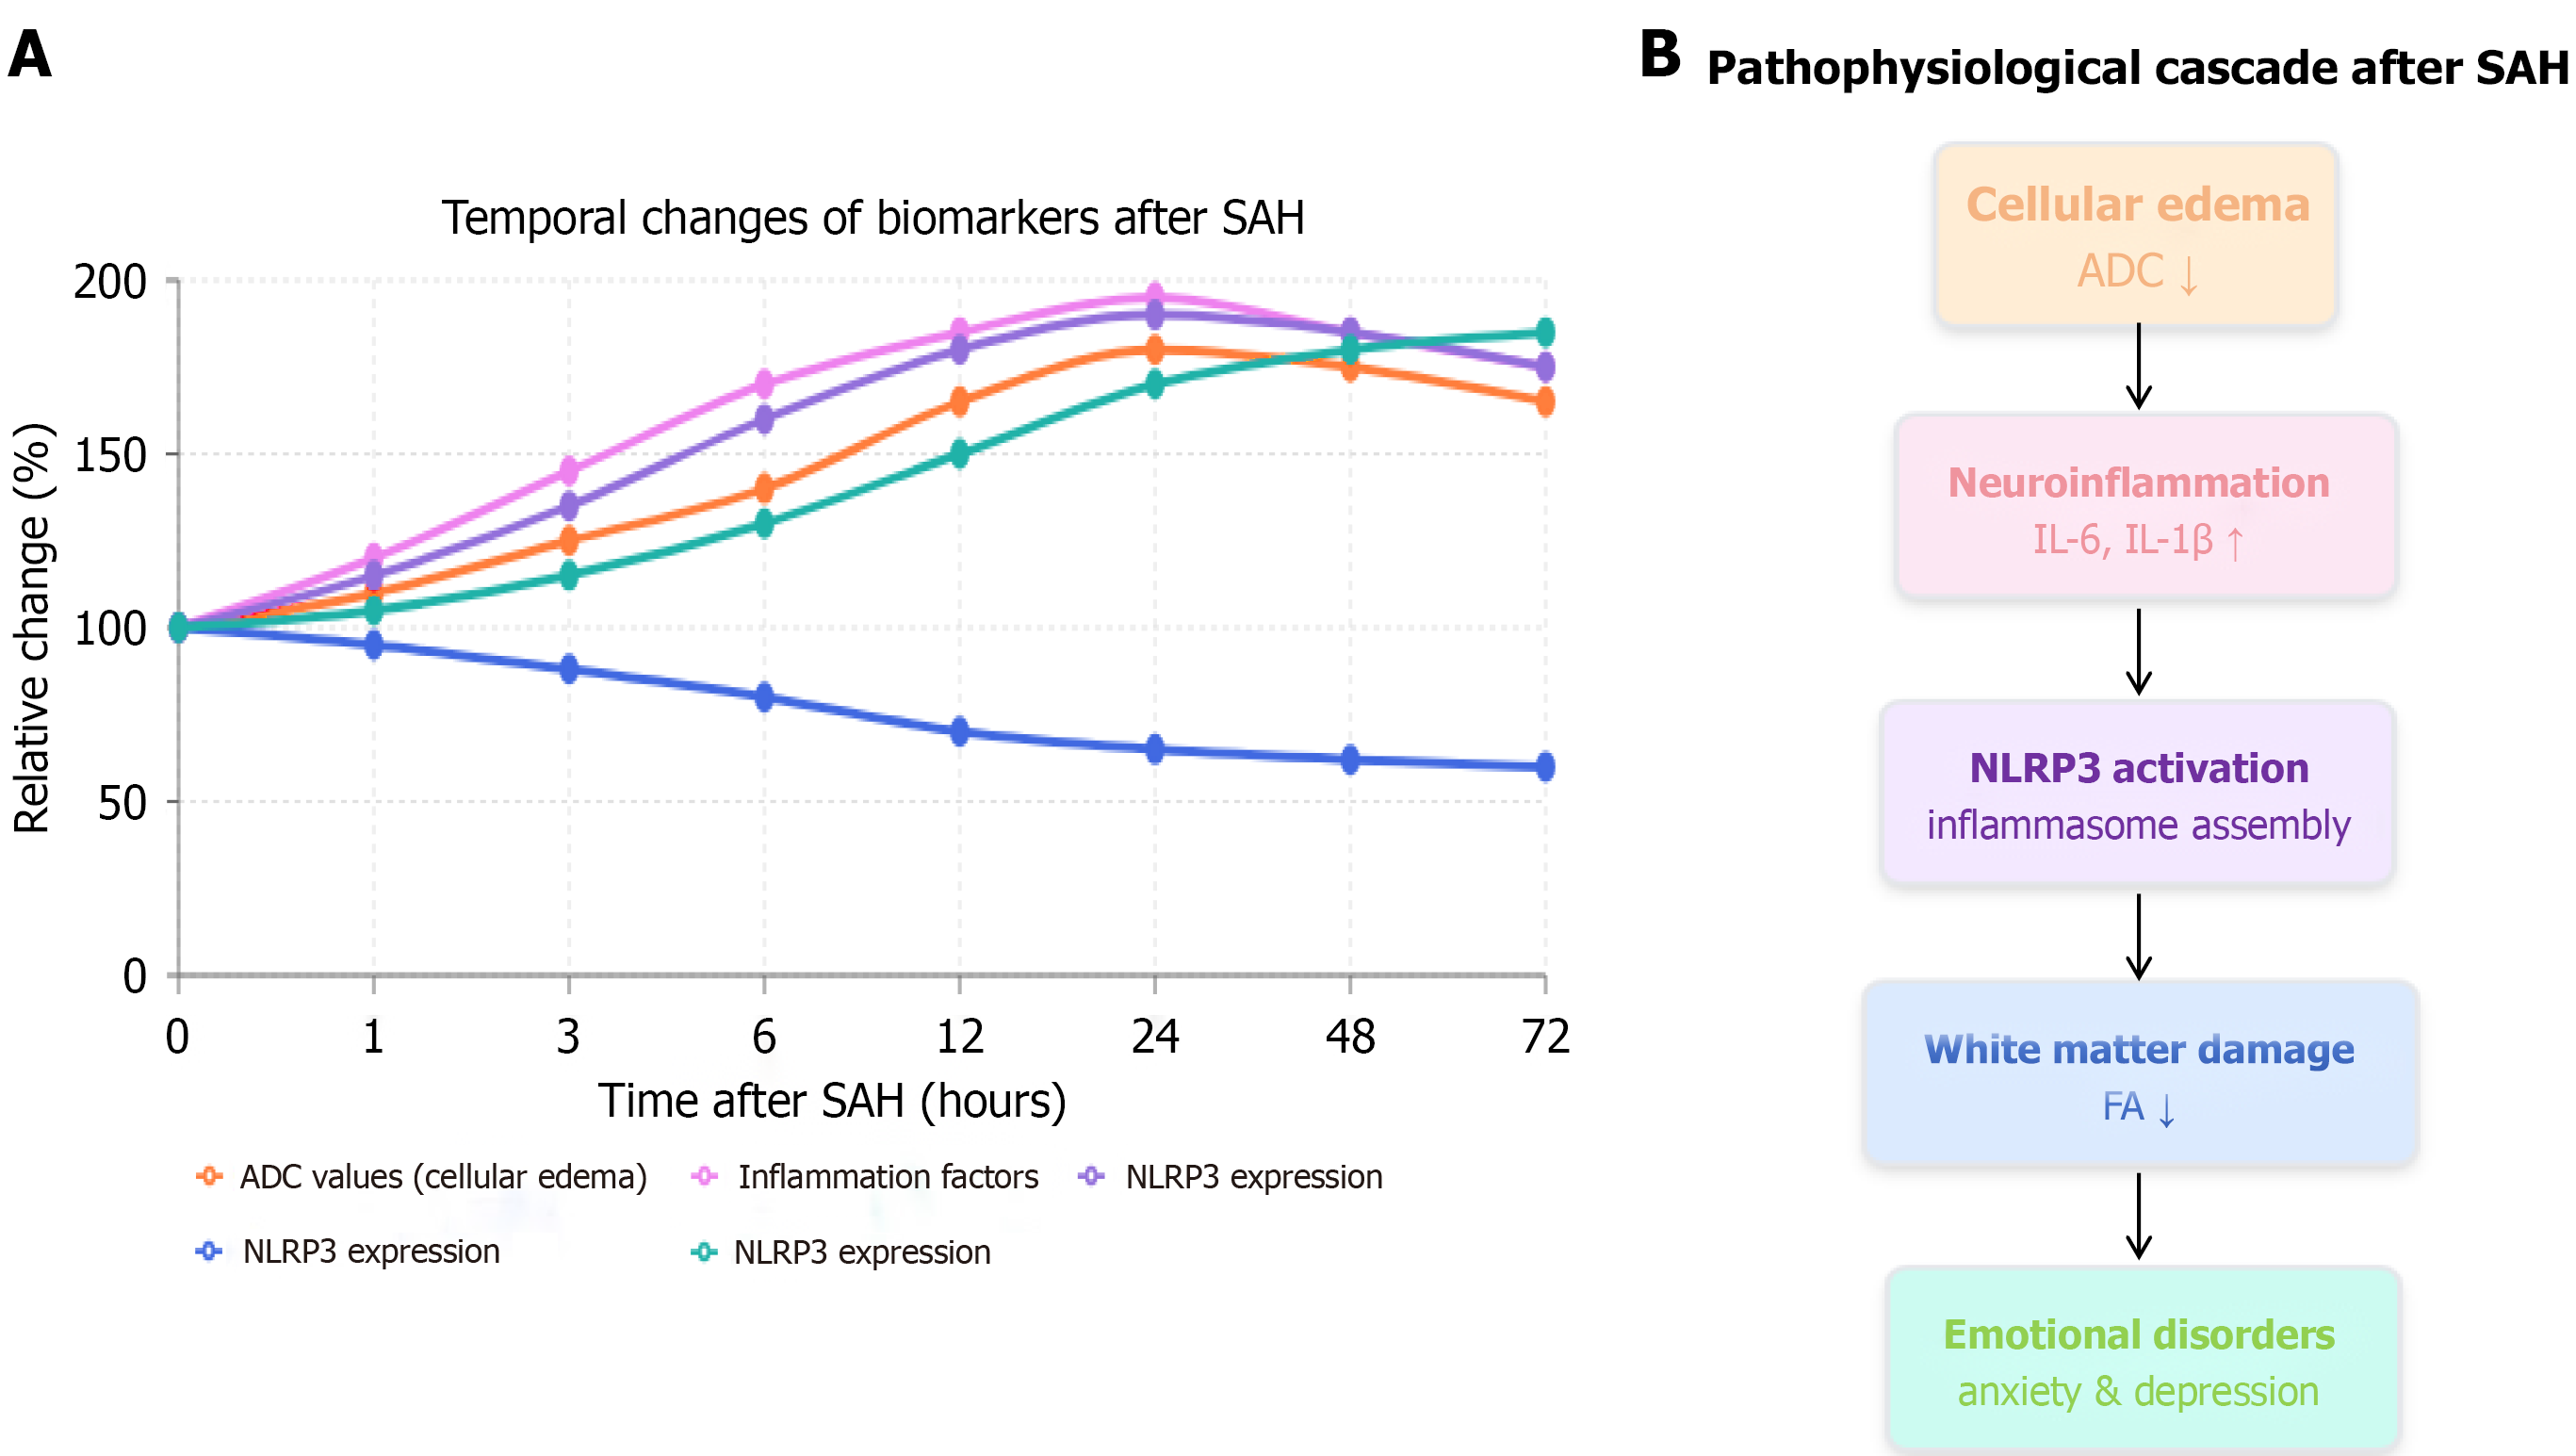
Figure 6 Temporal dynamic analysis and pathophysiological cascade process after subarachnoid hemorrhage.
A: Time-course curves of various indicators after subarachnoid hemorrhage (SAH), showing that cellular edema appears earliest (1 hour), followed by elevation of inflammatory factors (6-12 hours), increased NOD-like receptor protein 3 expression (12-24 hours), decreased fractional anisotropy values (24-48 hours), and aggravated anxiety-depression behavior (24-72 hours); B: Proposed pathophysiological cascade model of “cellular edema → neuroinflammation → NOD-like receptor protein 3 activation → white matter fiber bundle damage → emotional disorders”, revealing the potential mechanistic link between early cellular changes and later behavioral manifestations after SAH. These temporal sequence characteristics provide important clues for understanding the mechanism of anxiety-depression disorders after SAH. SAH: Suba
- Citation: Qin L, Wang K, Jiang LP, Xiao Z, Luo S. Correlation between anxiety-depression disorders and brain structural connectivity abnormalities after subarachnoid hemorrhage. World J Psychiatry 2025; 15(12): 111754
- URL: https://www.wjgnet.com/2220-3206/full/v15/i12/111754.htm
- DOI: https://dx.doi.org/10.5498/wjp.v15.i12.111754