
















©The Author(s) 2025.
World J Psychiatry. Dec 19, 2025; 15(12): 111754
Published online Dec 19, 2025. doi: 10.5498/wjp.v15.i12.111754
Published online Dec 19, 2025. doi: 10.5498/wjp.v15.i12.111754
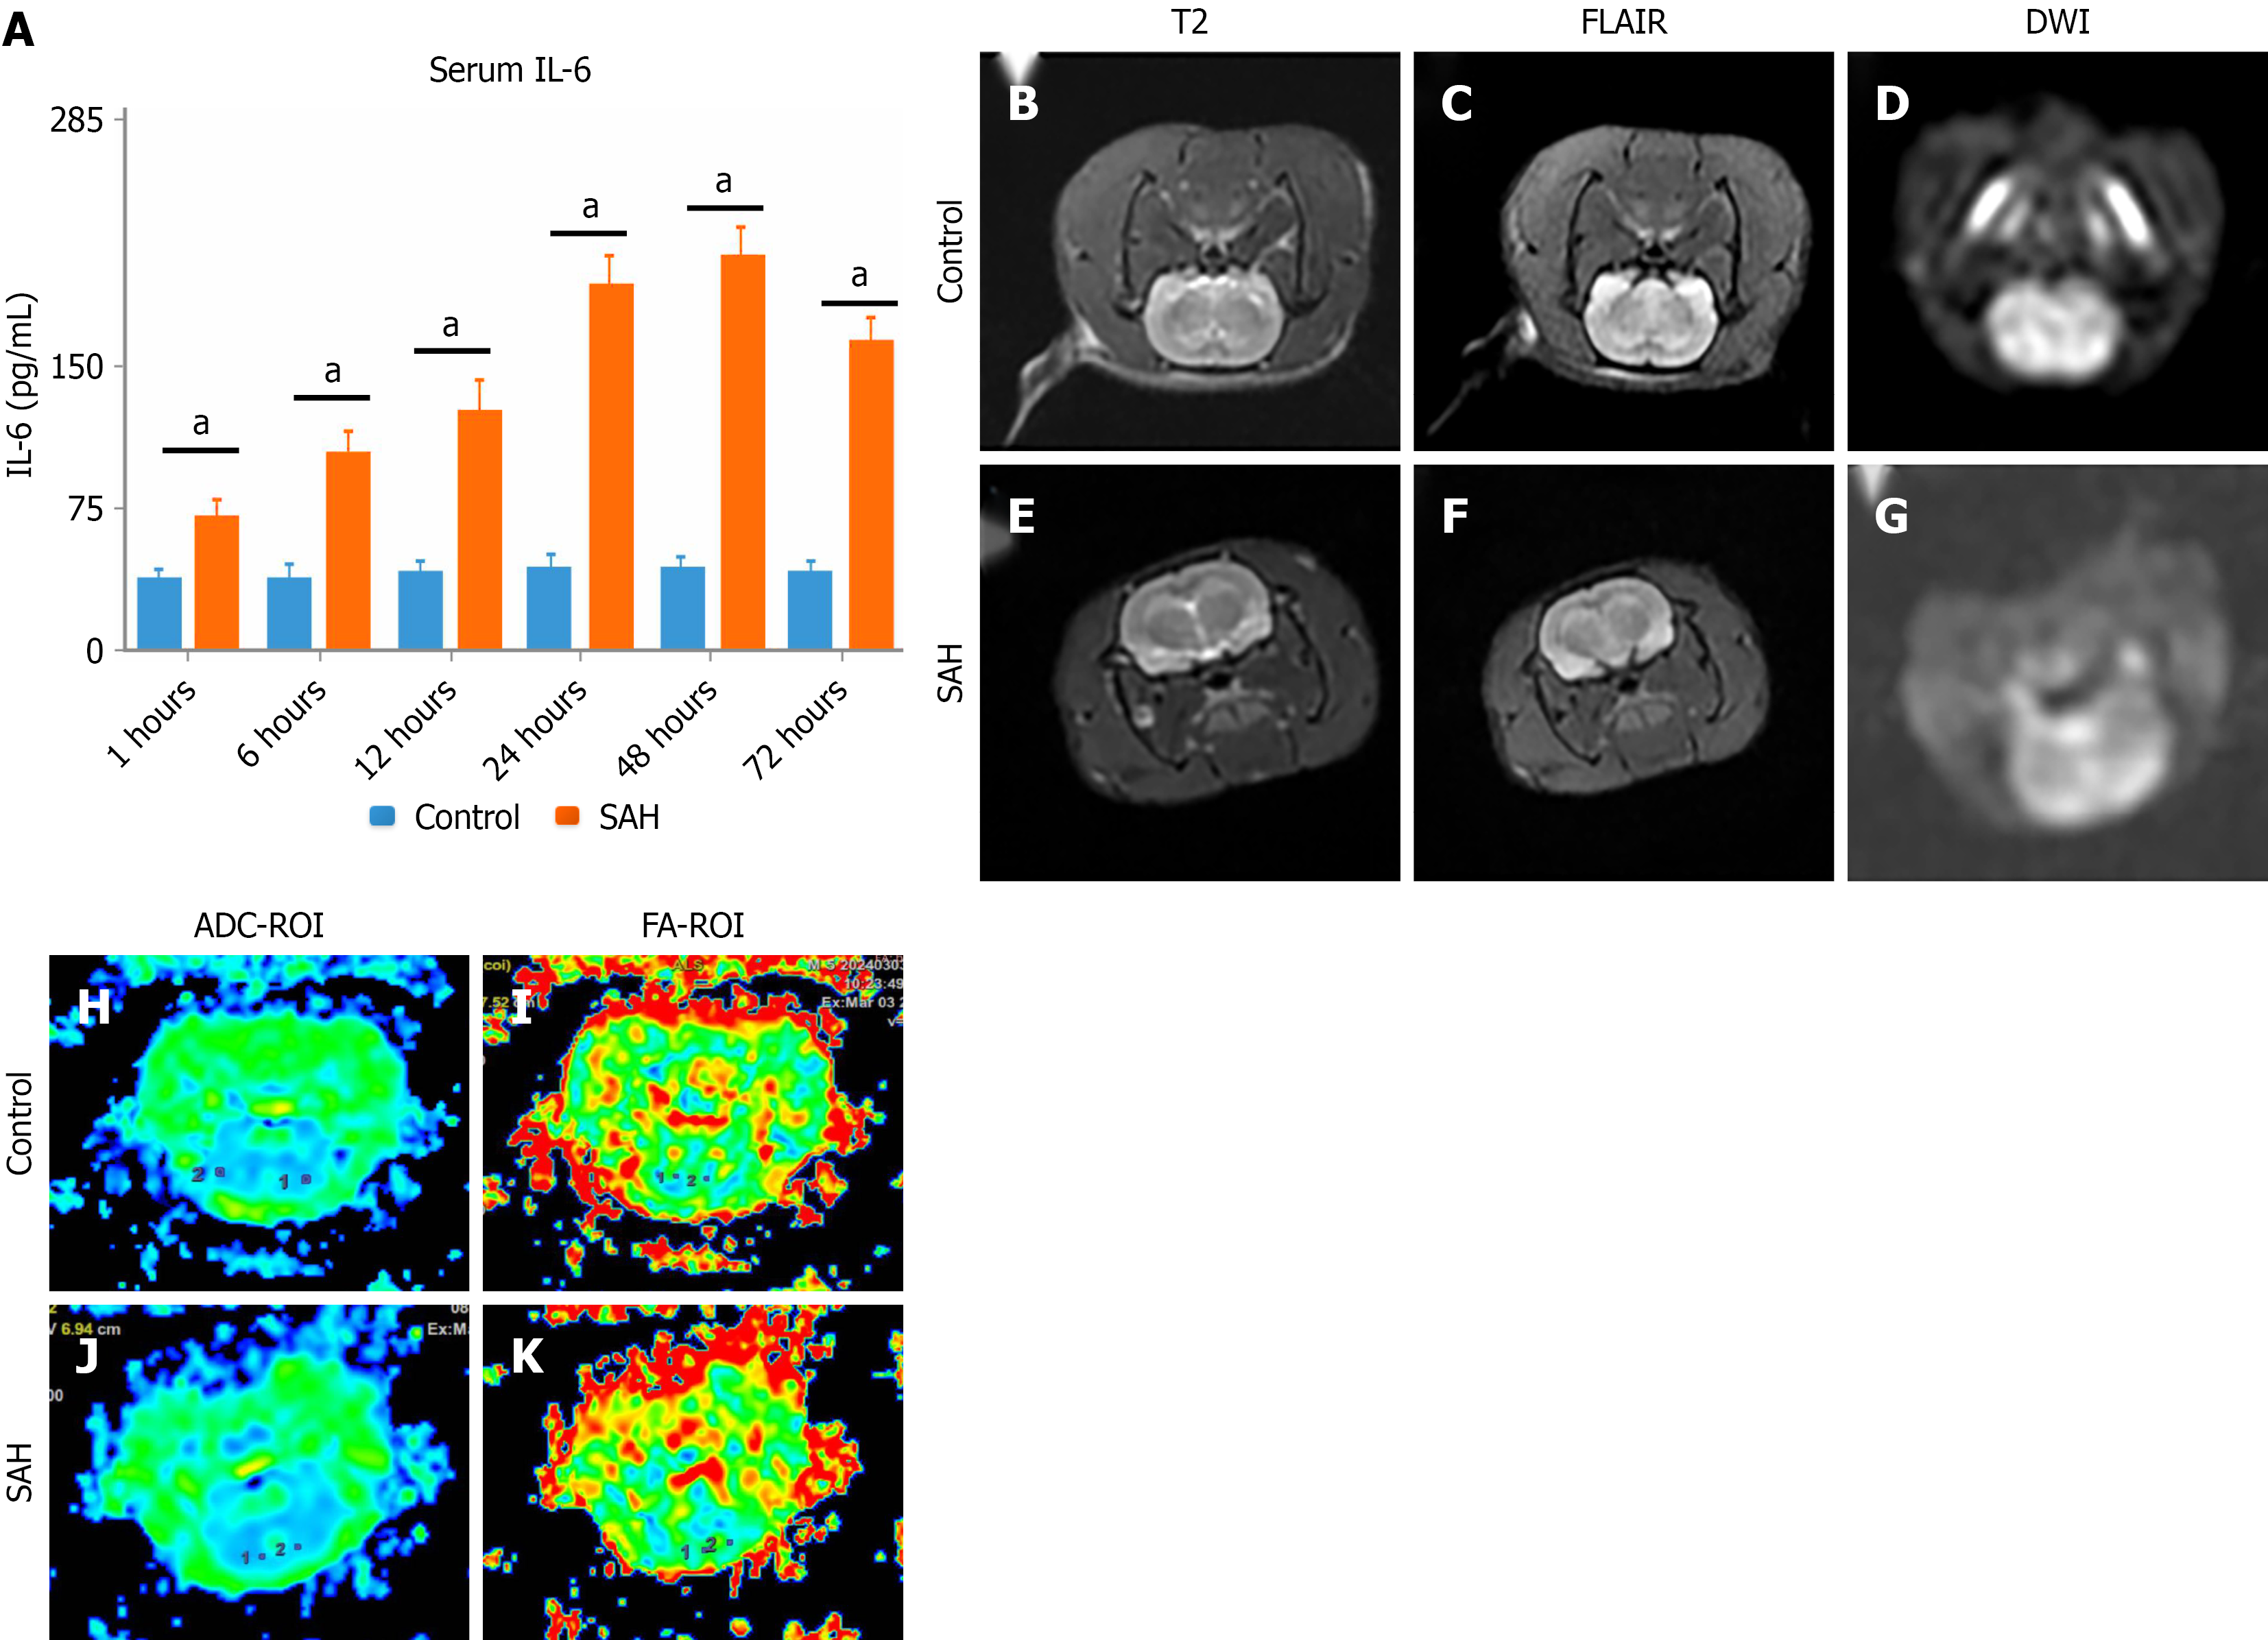
Figure 3 Correlation analysis of cerebral imaging changes and inflammatory response.
A: Serum interleukin-6 levels comparison between control (blue) and subarachnoid hemorrhage (SAH) groups (orange) showing significantly elevated inflammatory markers in SAH patients; B-D: Representative T2-weighted (B), fluid-attenuated inversion-recovery (C), and diffusion weighted imaging (D) sequences from control subjects demonstrating normal brain parenchyma; E-G: Representative T2-weighted (E), fluid-attenuated inversion-recovery (F), and diffusion weighted imaging (G) sequences from SAH patients revealing hyperintense signal changes indicative of tissue edema and inflammatory infiltration; H-K: Diffusion tensor imaging analysis with apparent diffusion coefficient-region of interest (H and J) and fractional anisotropy-region of interest (I and K) color-coded maps. Control group (H and I) exhibits uniform signal distribution, while SAH group (J and K) shows heterogeneous patterns reflecting white matter microstructural damage. Color scale represents diffusion parameters with warmer colors indicating higher values. SAH: Subarachnoid hemorrhage; IL-6: Interleukin-6; T2: T2-weighted; FLAIR: Fluid-attenuated inversion-recovery; DWI: Diffusion weighted imaging; ADC: Apparent diffusion coefficient; FA: Fractional anisotropy; ROI: Region of interest.
- Citation: Qin L, Wang K, Jiang LP, Xiao Z, Luo S. Correlation between anxiety-depression disorders and brain structural connectivity abnormalities after subarachnoid hemorrhage. World J Psychiatry 2025; 15(12): 111754
- URL: https://www.wjgnet.com/2220-3206/full/v15/i12/111754.htm
- DOI: https://dx.doi.org/10.5498/wjp.v15.i12.111754