
















©The Author(s) 2025.
World J Psychiatry. Oct 19, 2025; 15(10): 109425
Published online Oct 19, 2025. doi: 10.5498/wjp.v15.i10.109425
Published online Oct 19, 2025. doi: 10.5498/wjp.v15.i10.109425
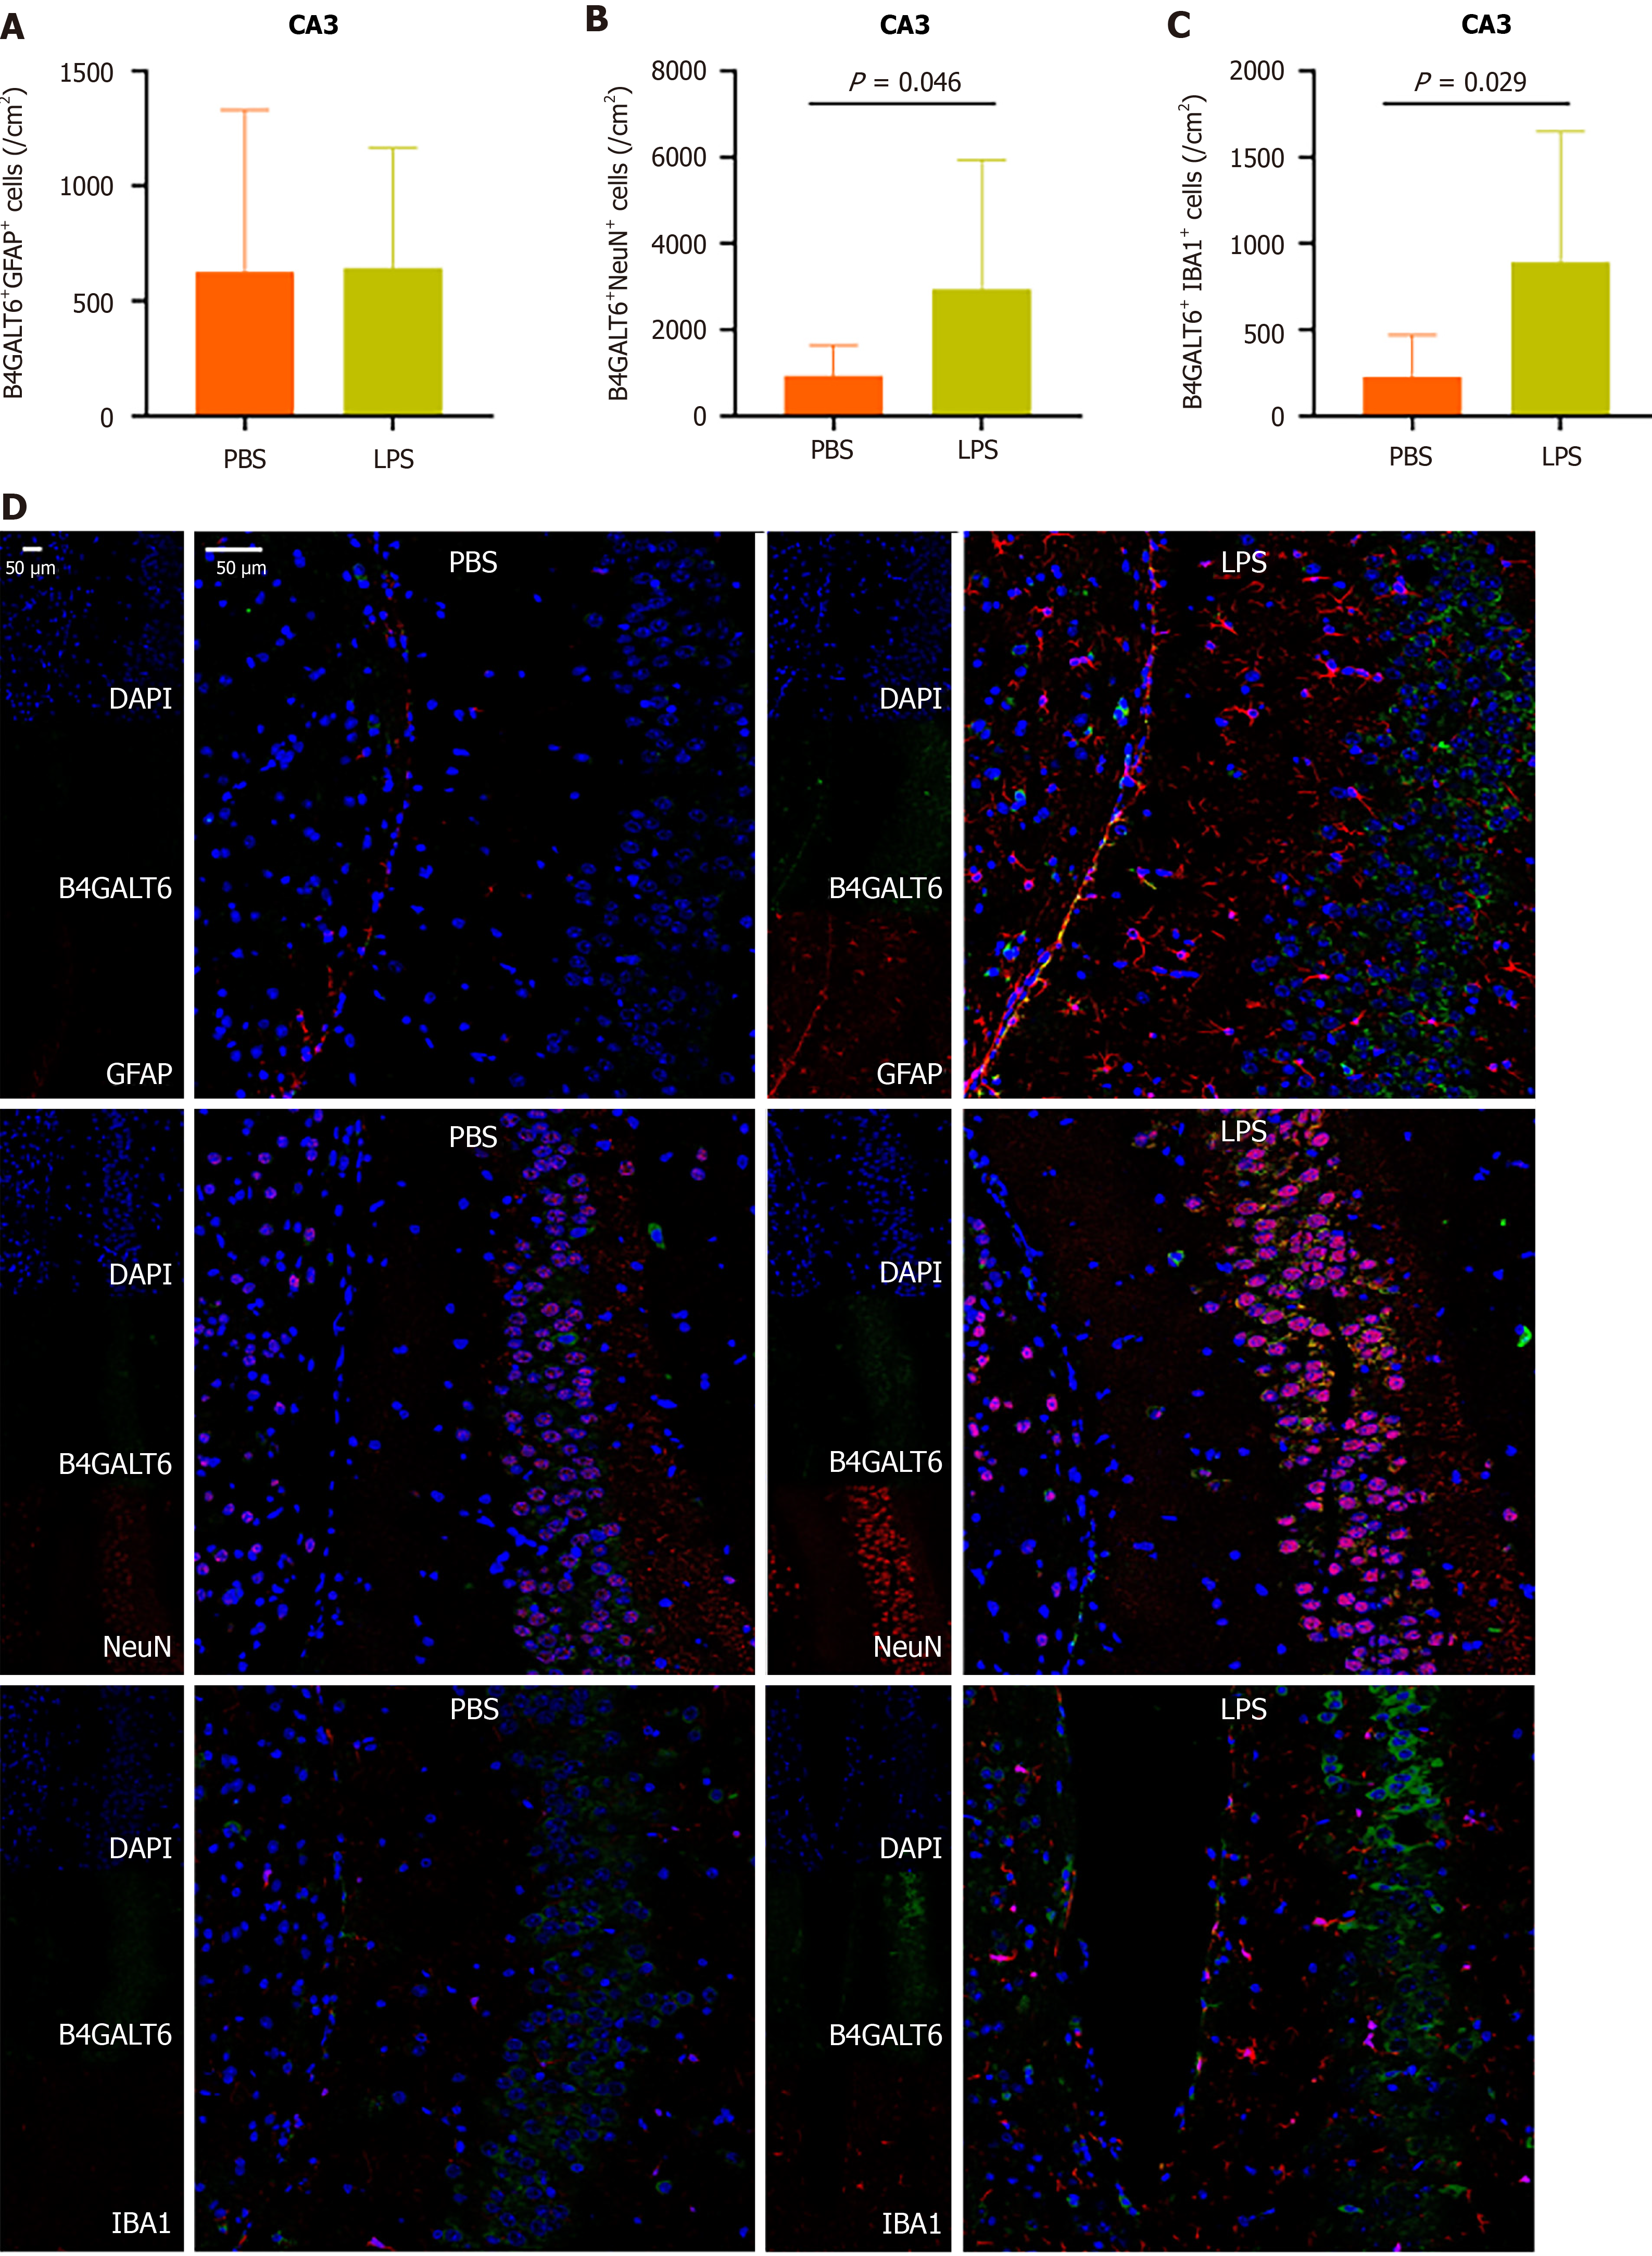
Figure 5 The main cellular differences between the phosphate buffer saline group and the lipopolysaccharides group in the hippocampal CA3 region were neurons and microglia.
A: Statistical results of the number of B4GALT6 and GFAP co-labeled cells (B4GALT6+GFAP+) in the hippocampal CA3 region, with no significant difference between the two groups; B: Statistical results of the number of B4GALT6 and NeuN co-labeled cells (B4GALT6+NeuN+) in the hippocampal CA3 region, revealing that the number of such cells in the lipopolysaccharides (LPS) group was significantly higher than that in the phosphate-buffered saline (PBS) group; C: Statistical results of the number of B4GALT6 and IBA1 co-labeled cells (B4GALT6+IBA1+) in the hippocampal CA3 region, showing that the number of such cells was significantly higher in the LPS group compared to the PBS group; D: Immunofluorescence co-localization images of the hippocampal CA3 region, presenting the co-localization of DAPI (blue), B4GALT6 (red) with NeuN (green), IBA1 (green), and GFAP (green) in the PBS group and LPS group. The numbers of positive co-labeled cells in neurons and microglia in the LPS group were both higher than those in the PBS group. LPS: Lipo
- Citation: Zhang SN, Luan D, Sheng BY, Xie B, Xiao L. Brain region and cell specificity of B4GALT6 in mice with depressive-like behavior: A pilot study. World J Psychiatry 2025; 15(10): 109425
- URL: https://www.wjgnet.com/2220-3206/full/v15/i10/109425.htm
- DOI: https://dx.doi.org/10.5498/wjp.v15.i10.109425