
















©The Author(s) 2025.
World J Psychiatry. Oct 19, 2025; 15(10): 108861
Published online Oct 19, 2025. doi: 10.5498/wjp.v15.i10.108861
Published online Oct 19, 2025. doi: 10.5498/wjp.v15.i10.108861
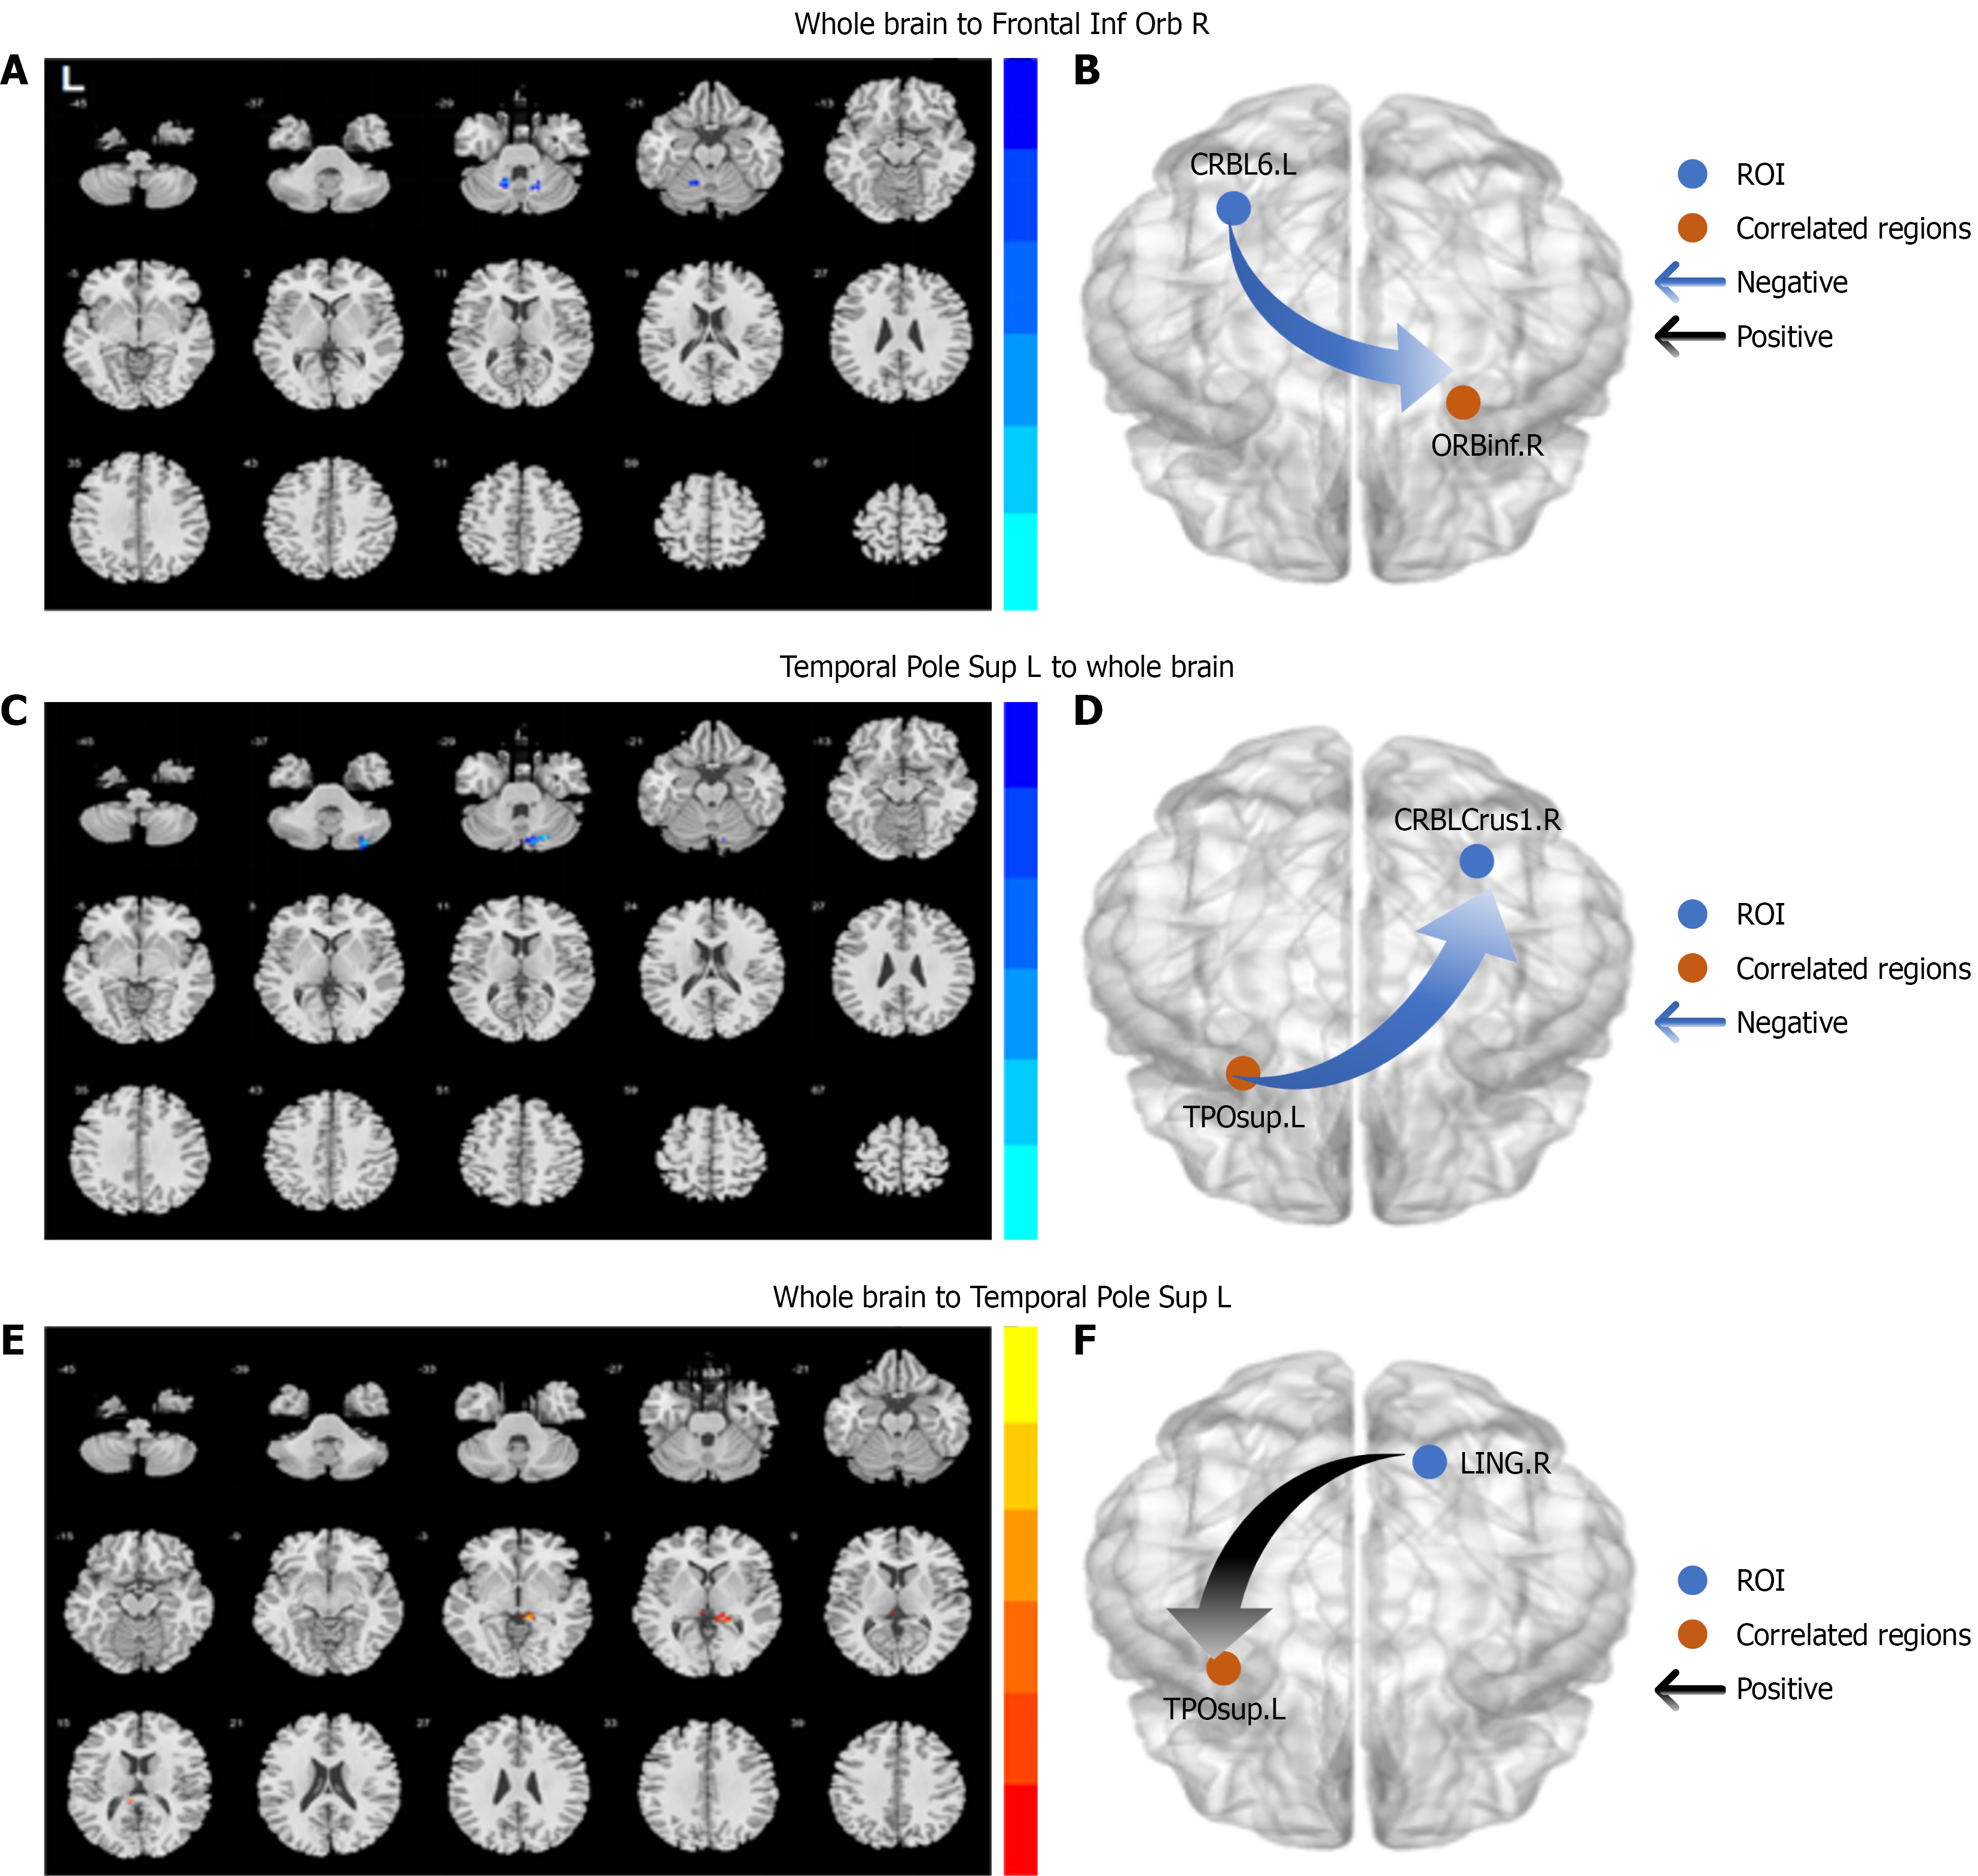
Figure 4 Granger causality analysis of effective connectivity between regions with abnormal local properties and other regions in the whole brain.
ORBinf.R, right orbital inferior frontal gyrus; CRBL6.L, left cerebellum 6; TPOsup.L, left temporal pole of superior temporal gyrus; CRBLCrus1.R: Right cerebellum Crus 1; LING.R, right lingual gyrus. Orange dots indicated ROIs, i.e., regions with abnormal local properties which were chosen as seed regions. Blue dots indicate correlated regions. The effective connectivity (EC) between correlated regions and the seed regions shows significant alterations. Blue and gray curved arrows indicated positive and negative causality respectively. The direction of the arrows indicated the EC directions. A: Compared to healthy controls, the EC between CRBL6.L and ORBinf.R in sepsis survivors significantly changed; B: The EC from CRBL6.L to ORBinf.R in sepsis survivors decreased; C: Compared to healthy controls, the EC between TPOsup.L and CRBLCrus1.R in sepsis survivors significantly changed; D: The EC from TPOsup.L to CRBLCrus1.R in sepsis survivors significantly decreased; E: The EC from LING.R to TPOsup.L in sepsis survivors significantly changed; F: The EC from LING.R to TPOsup.L in sepsis survivors significantly increased.
- Citation: Li Y, Chen JQ, Wang H, Yang JJ, Ji MH. Frontal, temporal, cerebellar changes link to sepsis survivors' cognitive issues: A resting state functional magnetic resonance imaging study. World J Psychiatry 2025; 15(10): 108861
- URL: https://www.wjgnet.com/2220-3206/full/v15/i10/108861.htm
- DOI: https://dx.doi.org/10.5498/wjp.v15.i10.108861