
















©The Author(s) 2025.
World J Psychiatry. Oct 19, 2025; 15(10): 108861
Published online Oct 19, 2025. doi: 10.5498/wjp.v15.i10.108861
Published online Oct 19, 2025. doi: 10.5498/wjp.v15.i10.108861
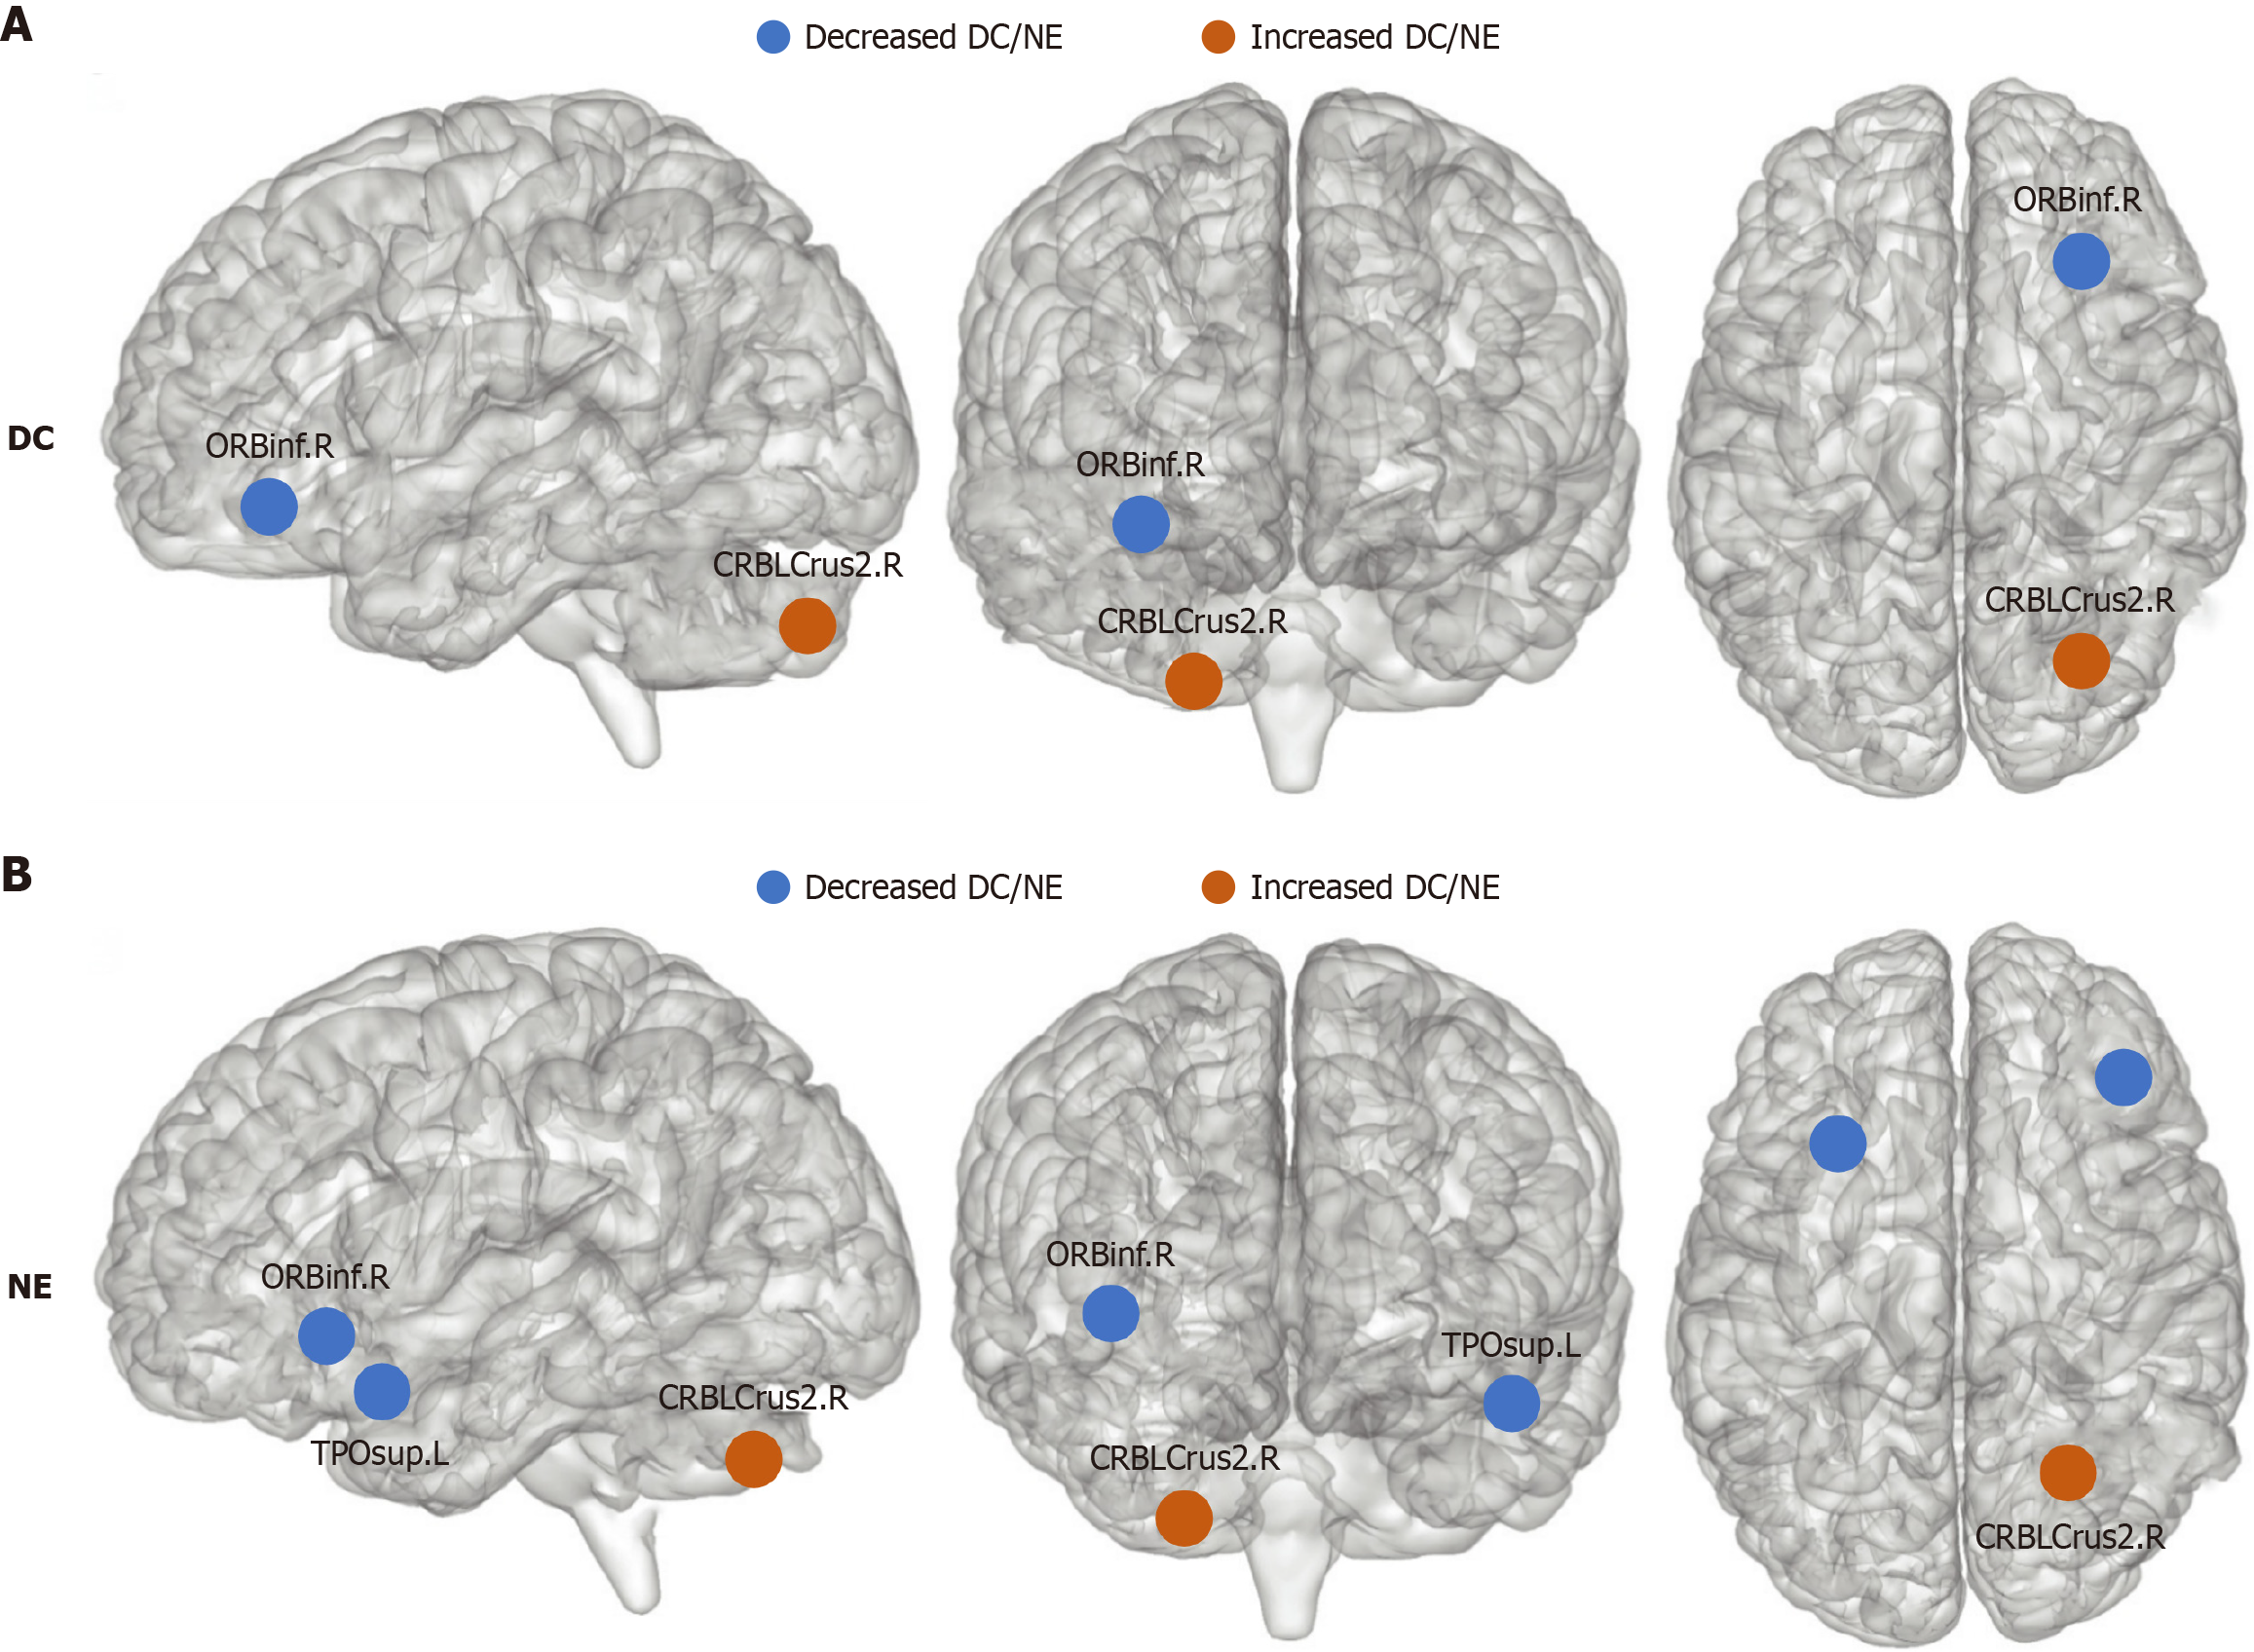
Figure 3 Brain regions with positive degree centrality and nodal efficiency alterations.
Blue or orange node represents a decreased or increased degree centrality/nodal efficiency value respectively. ORBinf.R, right orbital inferior frontal gyrus; CRBLCrus2.R, right cerebellum Crus 2; TPOsup.L, left temporal pole of superior temporal gyrus. A: Compared to healthy controls, sepsis survivors had decreased DC in ORBinf.R and increased DC in CRBLCrus2.R; B: Sepsis survivors had decreased NE in ORBinf.R and TPOsup.L and increased NE in CRBLCrus2.R. DC: Degree centrality; NE: Nodal efficiency.
- Citation: Li Y, Chen JQ, Wang H, Yang JJ, Ji MH. Frontal, temporal, cerebellar changes link to sepsis survivors' cognitive issues: A resting state functional magnetic resonance imaging study. World J Psychiatry 2025; 15(10): 108861
- URL: https://www.wjgnet.com/2220-3206/full/v15/i10/108861.htm
- DOI: https://dx.doi.org/10.5498/wjp.v15.i10.108861